TA ANN HOLDINGS BERHAD (TAANN 5012)
SNAPSHOT
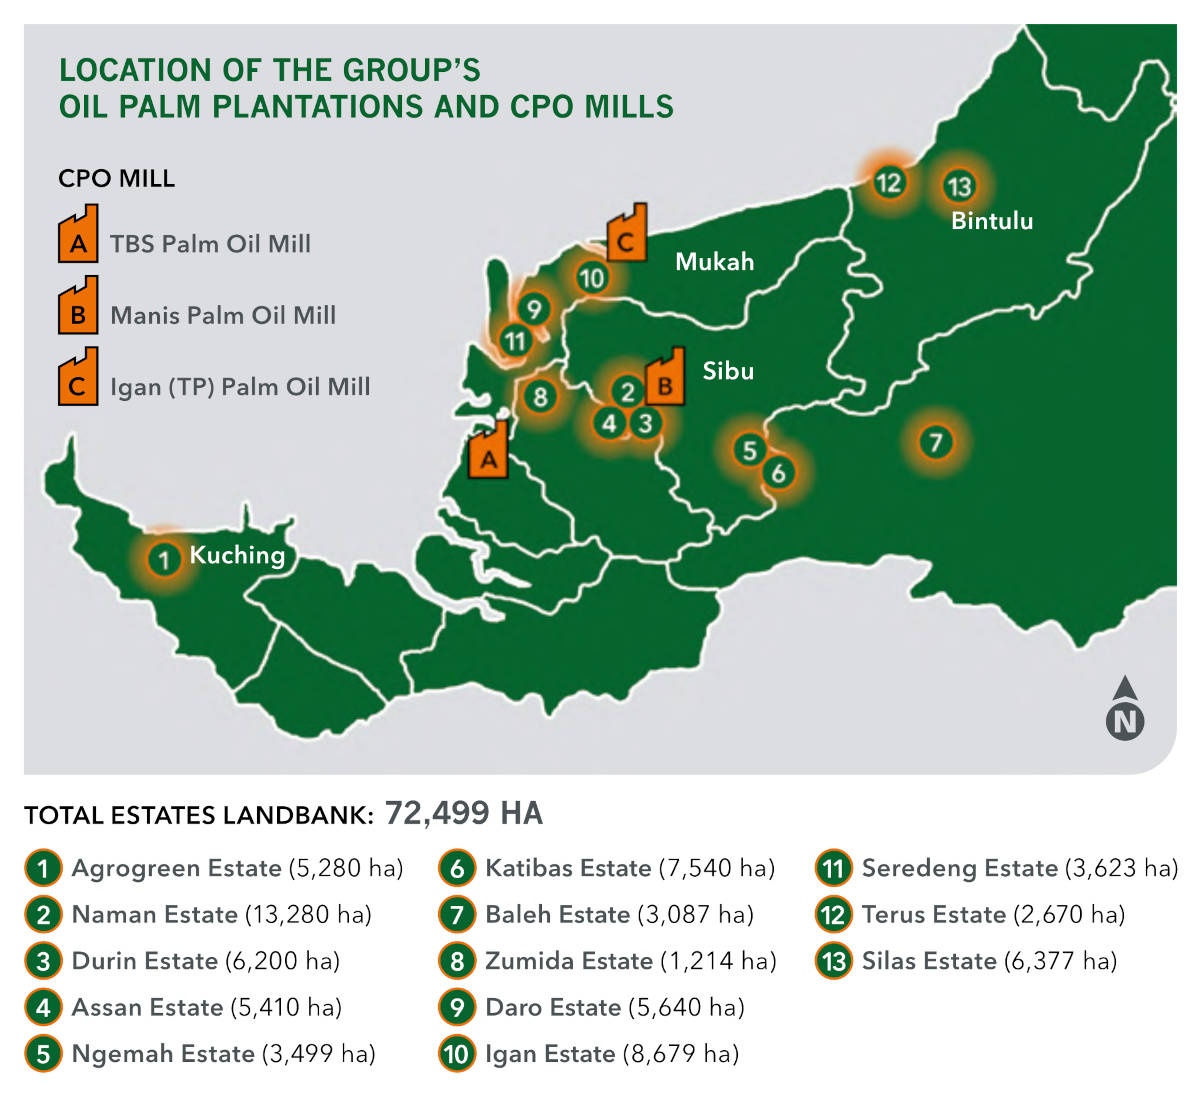
Ta Ann Holdings Berhad (Ta Ann) was founded by a group of Sarawak entrepreneurs in the 1980s. It has grown from a small timber-trading firm to a listed corporate group with interests in timber, oil palm and other agricultural products. Since it’s listing on Bursa Malaysia on 23 November 1999, Ta Ann has diversified progressively and substantially into oil palm plantations. The group has a plantation landbank of over 95,000 hectares, with 13 oil palm estates covering 72,499 hectares and 3 Palm Oil mills. Although being founded as a timber company, the bulk of Ta Ann’s revenue and profits now come from oil palm activities including oil palm cultivation, milling of crude palm oil (CPO) and trading in other oil palm products. Ta Ann also owns a 29.4% stake (approx 82.05 million shares) in Sarawak Plantations Berhad. In its timber division, Ta Ann produces PEFC-certified plywood (including structural panels, concrete panels and coated concrete panels), sawn timber, and laminated moulding products.
- Datuk Amar Abdul Hamed bin Haji Sepawi
- Datuk Wahab bin Haji Dolah
- Dato Sri Ding Jack Sung
- Dato Wong Kuo Hea
2000 – Began forest plantation and diversified into the oil palm industry.
2005 – Expanded to Tasmania, Australia.
2006 – Set up Manis Oil Mill and began milling oil palm fruits in-house.
2013 – First harvest of planted forests, followed by replanting.
2018 – Acquired a 30.4% in Sarawak Plantations Bhd for RM169.9 million or RM2.00 per share in a related party transaction with Cermat Ceria Sdn Bhd, a company controlled by Ta Ann Chairman Datuk Amar Hamed Sepawi.
| YE 31-Dec | 2020 | 2021 | 2022 | 2023 | 2024 |
| Revenue (RM mil) | 1,218.0 | 1,894.1 | 2,187.4 | 1,680.7 | 1,649.8 |
| Operating Profit (RM mil) | 92.8 | 416.2 | 498.5 | 265.2 | 218.8 |
| Dividends Received (RM mil) | 4.2 | 8.5 | 16.8 | 12.3 | 28.0 |
| Profit Before Tax (RM mil) | 126.3 | 493.7 | 524.3 | 270.1 | 313.6 |
| Net Profit After Tax (RM mil) | 47.2 | 317.6 | 320.5 | 157.2 | 180.6 |
| EPS (RM) | 0.107 | 0.721 | 0.728 | 0.357 | 0.410 |
| DPS (RM) | 0.15 | 0.30 | 0.40 | 0.25 | 0.35 |
| Shareholders Equity (RM mil) | 1,446.6 | 1,613.7 | 1,757.8 | 1,812.1 | 1,839.5 |
| No of Shares (millions) | 444.8 | 444.8 | 444.8 | 444.8 | 444.8 |
| Shareholders Equity Per Share (RM) | 3.25 | 3.63 | 3.95 | 4.07 | 4.14 |
| Share Price - Close (RM) | 3.03 | 3.51 | 3.78 | 3.66 | 4.28 |
| Op Profit + Div Received (RM mil) | 97.1 | 424.7 | 515.3 | 277.5 | 246.8 |
| Capital Employed (RM mil) | 1,788.6 | 1,698.6 | 1,706.7 | 1,684.4 | 1,733.4 |
| Return on Av Capital Employed (%) | 5.1% | 24.4% | 30.3% | 16.4% | 14.4% |
| Return on Av Equity (%) | 3.3% | 20.8% | 19.0% | 8.8% | 9.9% |
| Production Volume | |||||
| Logs (cubic metres) | 237,814 | 248,637 | 315,081 | 272,450 | 183,638 |
| Fresh Fruit Bunches (tonnes) | 709,489 | 690,654 | 703,627 | 677,022 | 667,214 |
| Crude Palm Oil (tonnes) | 271,401 | 284,447 | 281,093 | 296,044 | 273,261 |
| Palm Kernel (tonnes) | 57,214 | 63,136 | 64,360 | 65,948 | 60,240 |
SHARE TRADING SUMMARY CY2025
| Share Price - High | RM4.36 |
| Share Price - Low | RM3.65 |
| Share Price - Close @ 31/12/25 | RM4.16 |
| Average Daily Volume | 326,262 shares |
| Volume - High | 5,161,800 shares |
| Volume - Low | 6,200 shares |
| Total Annual Volume | 79,608,000 shares |
|
Annual Turnover (% of Share Capital) |
17.9% |
TOP SHAREHOLDERS
| As at 2 April 2025 | Direct | Indirect |
| Mountex Sdn Bhd | 21.3% | - |
| Dato Sri Wahab Dolah | 9.4% | 3.2% |
| Datuk Amar Abdul Hamed Sepawi | 7.5% | 27.1% |
| Upaya Rajang Sdn Bhd | 4.2% | 3.2% |
| Dato Wong Kuo Hea | 2.8% | 26.9% |
| Total | 45.2% |
FFB YIELD
“Our oil palm division delivered a commendable performance in 2024, driven primarily by high CPO prices, positioning it as the key contributor to the Group’s profits. Fresh fruit bunch (FFB) production declined by 2% year-on-year due to ongoing replanting efforts and adverse wet weather conditions that affected pollination and fruit formation. However, the increased yield from young mature areas in the Kapit region helped reduce the overall impact. Since early last year, improved manpower availability has enabled our Group to meet all manuring dosage requirements. These improved nutrient applications are expected to drive higher production yields by 2026, potentially as early as late 2025.”
Source: Ta Ann 2024 Annual Report (Page 26)
FINANCIALS
| Year Ending (RM) |
2020 31-Dec |
2021 31-Dec |
2022 31-Dec |
2023 31-Dec |
2024 31-Dec |
| Revenue | 1,217,998,028 | 1,894,063,913 | 2,187,446,076 | 1,680,697,302 | 1,649,809,424 |
| Cost of Sales | (967,234,087) | (1,298,801,941) | (1,476,012,496) | (1,270,615,997) | (1,248,829,687) |
| Gross Profit | 250,763,941 | 595,261,972 | 711,433,580 | 410,081,305 | 400,979,737 |
| Other Operating Income | 11,484,807 | 16,439,046 | 16,881,547 | 17,530,773 | 13,678,994 |
| Distribution Expenses | (71,184,822) | (118,621,610) | (139,095,147) | (92,840,591) | (106,295,623) |
| Administrative Expenses | (50,353,117) | (52,080,417) | (58,821,426) | (53,667,667) | (51,469,615) |
| Other Operating Expenses | (47,899,881) | (24,751,327) | (31,896,898) | (15,886,197) | (38,067,801) |
| Operating Profit/(Loss) | 92,810,928 | 416,247,664 | 498,501,656 | 265,217,623 | 218,825,692 |
| Change in FV of Biological Assets | 27,826,791 | 35,770,745 | (12,253,583) | (21,672,254) | 53,975,146 |
| Finance Income | 2,645,379 | 4,094,722 | 8,102,191 | 10,870,338 | 12,022,427 |
| Finance Costs | (19,717,275) | (16,802,528) | (11,157,715) | (9,574,210) | (5,718,830) |
| Share of Associates | 22,726,000 | 54,390,881 | 41,098,095 | 25,260,611 | 34,452,516 |
| Profit Before Tax | 126,291,823 | 493,701,484 | 524,290,644 | 270,102,108 | 313,556,951 |
| Tax Expense | (48,629,074) | (101,260,063) | (129,323,165) | (68,304,358) | (82,420,444) |
| Non-Controlling Interests | (30,446,384) | (74,859,504) | (74,491,667) | (44,549,780) | (50,552,889) |
| Net Profit attributable to Owners | 47,216,365 | 317,581,917 | 320,475,812 | 157,247,970 | 180,583,618 |
| Basic/Diluted EPS (Sen) | 10.72 | 72.10 | 72.76 | 35.70 | 41.00 |
|
(RM '000) Year Ending |
2020 31-Dec |
2021 31-Dec |
2022 31-Dec |
2023 31-Dec |
2024 31-Dec |
| Cash and Cash Equivalents | 272,386 | 455,994 | 524,706 | 499,930 | 434,302 |
| Inventories | 154,792 | 131,223 | 146,780 | 120,263 | 111,849 |
| Trade and Other Receivables | 51,091 | 53,022 | 44,628 | 45,621 | 40,939 |
| Property, Plant and Equipment | 757,105 | 734,102 | 707,833 | 691,635 | 651,197 |
| Right-of-Use Assets | 214,077 | 197,165 | 195,220 | 189,474 | 193,124 |
| Bearer Plants and Biological Assets | 736,017 | 774,820 | 775,542 | 767,035 | 822,233 |
| Investment in Associates & JV | 225,232 | 266,878 | 283,897 | 296,639 | 307,226 |
| Goodwill & Other Intangible Assets | 90,474 | 86,864 | 86,044 | 85,228 | 84,404 |
| Other Assets | 44,977 | 41,699 | 25,370 | 29,576 | 27,899 |
| Total Assets | 2,546,152 | 2,741,769 | 2,790,020 | 2,725,401 | 2,673,172 |
| Borrowings | 496,462 | 378,153 | 282,533 | 181,539 | 130,784 |
| Trade and Other Payables | 178,409 | 251,361 | 162,255 | 143,241 | 158,568 |
| Deferred Tax Liabilities | 200,066 | 217,510 | 231,870 | 227,387 | 237,035 |
| Employee Benefits | 37,283 | 37,951 | 41,804 | 39,298 | 42,094 |
| Other Liabilities | 69,374 | 80,324 | 122,719 | 131,127 | 67,750 |
| Total Liabilities | 981,594 | 965,299 | 841,181 | 722,591 | 636,232 |
| Net Assets | 1,564,558 | 1,776,470 | 1,948,839 | 2,002,810 | 2,036,941 |
| Share Capital | 444,844 | 444,844 | 444,844 | 444,844 | 444,844 |
| Retained Earnings | 998,035 | 1,166,894 | 1,311,185 | 1,364,456 | 1,390,878 |
| Other Reserves | 3,681 | 1,981 | 1,761 | 2,850 | 3,803 |
| Equity attributable to Owners | 1,446,560 | 1,613,719 | 1,757,790 | 1,812,150 | 1,839,525 |
| Non-Controlling Interests | 117,998 | 162,750 | 191,050 | 190,660 | 197,416 |
| Total Equity | 1,564,558 | 1,776,470 | 1,948,839 | 2,002,810 | 2,036,941 |
| No of Shares | 444,843,900 | 444,843,900 | 444,843,900 | 444,843,900 | 444,843,900 |
| Year Ending (RM'000) |
2020 31-Dec |
2021 31-Dec |
2022 31-Dec |
2023 31-Dec |
2024 31-Dec |
| Net Cash from Operating Activities | 307,691,333 | 516,057,884 | 484,539,261 | 263,606,103 | 293,847,857 |
| Dividends Received | 4,248,401 | 8,496,802 | 16,780,606 | 12,307,743 | 27,967,906 |
| Interest Received | 2,645,379 | 4,094,722 | 8,102,191 | 10,870,338 | 12,022,427 |
| Payment of Lease Liabilities | (13,563,240) | (6,400,223) | (1,363,369) | (851,734) | (1,264,491) |
| Hire Purchase Financing Interest | (261,352) | (292,086) | (486,148) | (478,755) | (561,161) |
| Interest Paid | (10,963,890) | (6,014,846) | (4,108,974) | (3,532,350) | (1,440,327) |
| Cash Flow before Capex | 289,796,631 | 515,942,253 | 503,463,567 | 281,921,345 | 330,572,211 |
| Acquisition of Property Plant & Equipment | (18,488,717) | (29,469,148) | (36,992,110) | (33,904,271) | (22,180,902) |
| Acquisition of Land Use Rights & Right-of-Use | 0 | 0 | 0 | 0 | (9,571,597) |
| Biological assets | (7,023,493) | (5,491,270) | (6,431,330) | (7,110,849) | (7,516,002) |
| Bearer plants | (25,413,535) | (32,759,240) | (34,343,411) | (34,420,342) | (25,855,083) |
| Disposal of Property Plant, Equipment & Right-of-Use | 5,712,556 | 1,972,322 | 1,482,152 | 2,144,349 | 960,095 |
| Free Cash Flow | 244,583,442 | 450,194,917 | 427,178,868 | 208,630,232 | 266,408,722 |
| Dividends paid to Non-Controlling Interest | (10,300,000) | (31,440,000) | (43,145,887) | (41,250,000) | (47,897,948) |
| Free Cash Flow attributable to Owners | 234,283,442 | 418,754,917 | 384,032,981 | 167,380,232 | 218,510,774 |
Cash Earnings & Utilization Metrics
| YE 31-Dec | 2019 | 2020 | 2021 | 2022 | 2023 | 2024 |
| Operating Profit (RM) | 99,988,709 | 92,810,928 | 416,247,664 | 498,501,656 | 265,217,623 | 218,825,692 |
| Dividends Received (RM) | 4,248,401 | 4,248,401 | 8,496,802 | 16,780,606 | 12,307,743 | 27,967,906 |
| EBIT (RM) | 104,237,110 | 97,059,329 | 424,744,466 | 515,282,262 | 277,525,366 | 246,793,598 |
| Net Cash from Operating Activities (RM) | 128,401,650 | 307,691,333 | 516,057,884 | 484,539,261 | 263,606,103 | 293,847,857 |
| Free Cash Flow attributable to Owners (RM) | 14,377,649 | 234,283,442 | 418,754,917 | 384,032,981 | 167,380,232 | 218,510,774 |
| Net Investments (RM) | (12,925,124) | (1,978,921) | (121,951) | 8,816,145 | (12,468,807) | (48,085,266) |
| Dividends Paid to Owners (RM) | 0 | (22,023,095) | (110,115,475) | (220,230,950) | (88,092,380) | (220,230,950) |
| Residual Cash Flow (RM) | 1,452,525 | 210,281,426 | 308,517,491 | 172,618,176 | 66,819,045 | (49,805,442) |
| Net Cash (RM) | (432,164,965) | (224,076,129) | 77,841,362 | 242,172,571 | 318,391,534 | 303,518,161 |
| Free Cash Flow per share (RM) | 0.032 | 0.527 | 0.941 | 0.863 | 0.376 | 0.491 |
| Net Capex (RM) | 90,390,519 | 45,213,189 | 65,747,336 | 76,284,699 | 73,291,113 | 64,163,489 |
| Net Capex / EBIT (%) | 86.7% | 46.6% | 15.5% | 14.8% | 26.4% | 26.0% |
| Net Capex / Operating Cash Flow (%) | 70.4% | 14.7% | 12.7% | 15.7% | 27.8% | 21.8% |
STAKEHOLDERS
Directors & CEO Remuneration
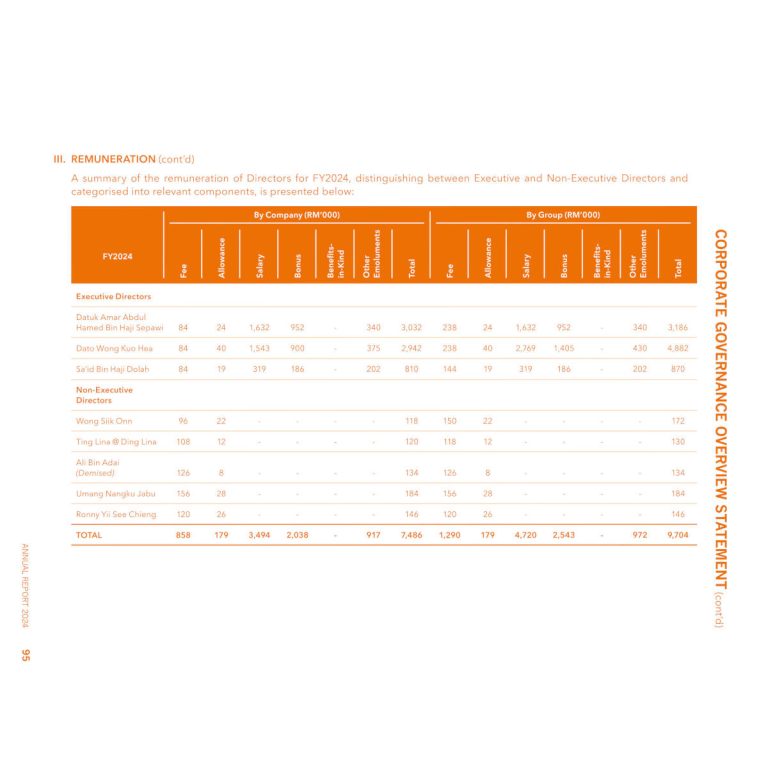
Executive & CEO: RM8.9 million
Non-Executive: RM0.8 million
CEO: RM4.9 million
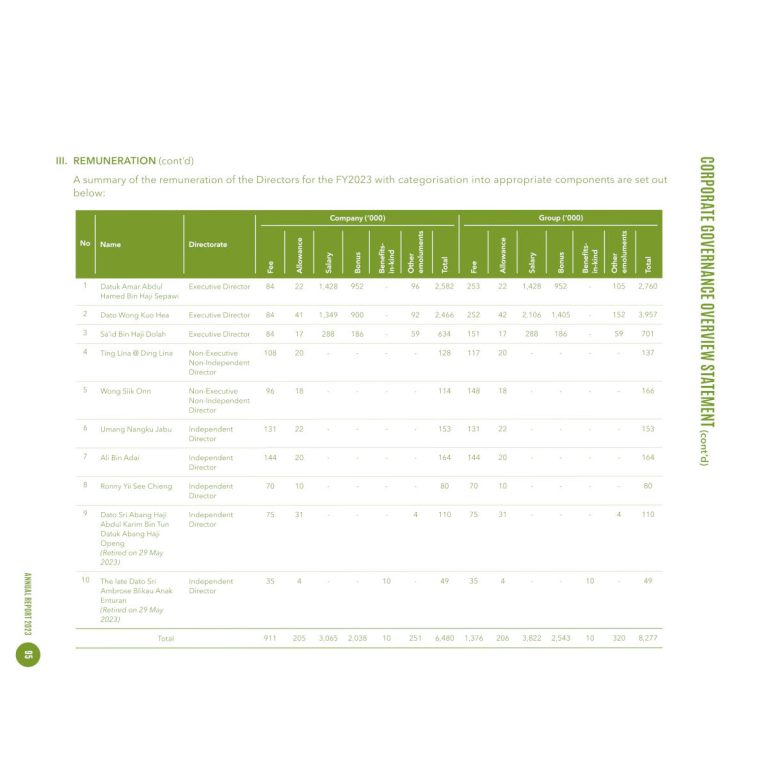
Executive & CEO: RM7.4 million
Non-Executive: RM0.9 million
CEO: RM4.0 million
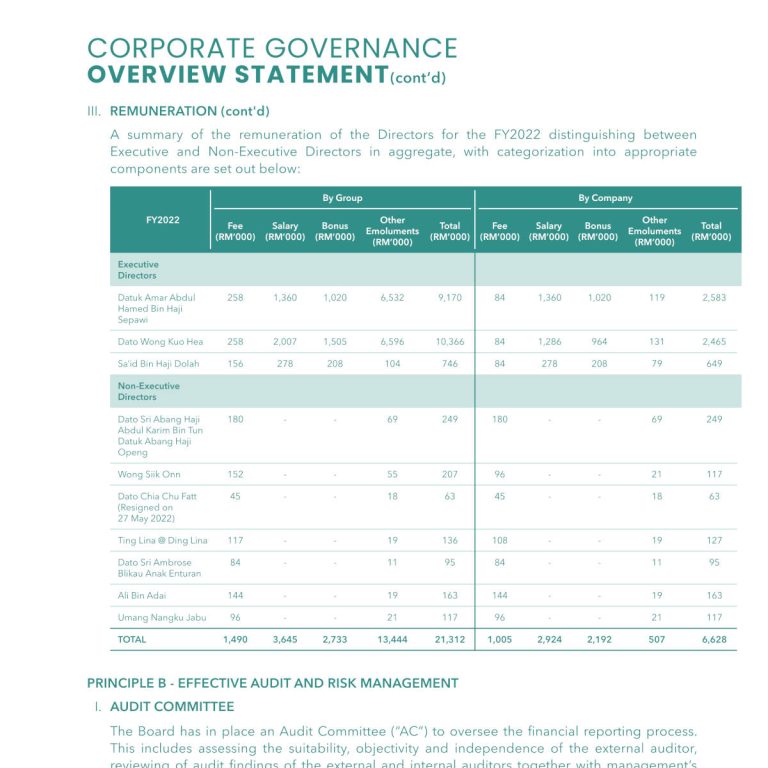
Executive & CEO: RM5.7 million
Non-Executive: RM0.9 million
CEO: RM2.5 million
Executive & CEO: RM6.1 million
Non-Executive: RM1.1 million
CEO: RM2.7 million