
KIM LOONG RESOURCES BERHAD (KMLOONG 5027)
SNAPSHOT
Kim Loong Resources Berhad is involved in cultivation of oil palm, processing of oil palm fresh fruit bunches, marketing of oil palm products, processing of oil palm fibre and biogas. It focuses on high-yield oil palm cultivation, sustainable milling in Johor, Sabah, and Sarawak, and has earned recognition for operational efficiency, strong shareholder returns, and pioneering biogas technology.
As at 31 January 2025, Kim Loong’s plantation land holdings total around 17,000 hectares of which 93% are fully planted. Around 71% of planted area consists of mature palms (above 6 years), 19% are young mature (below 6 years) while 10% comprises immature plants. Plantations are located in Johor, Sabah and Sarawak. In addition, Kim Loong owns and operates three palm oil mills located in the vicinity of its plantations in Kota Tinggi (Johor), Keningau (Sabah) and Telupid (Sabah). These mills have a combined FFB processing capacity of 1.8 million MT per annum.
1967 – Sharikat Kim Loong Sendirian Berhad (“SKL”), holding company of Kim Loong Resources Berhad commenced business with 1,000-acre rubber plantation at Ulu Tiram, Johor. The first planting of oil palm started in 1968.
1977 – Incorporation of Kim Loong Palm Oil Sdn Bhd (KLPO) by SKL to undertake the milling operations. Relocation of palm oil mill to Kota Tinggi, Johor.
1996 – Kim Loong Palm Oil Mills Sdn Bhd which commenced operations in 1996.
1981 – SKL expanded into Sabah by acquiring 1,000 acres of land in Sandakan, Sabah. Cocoa was first planted on the land followed by oil palm.
1997 – JV with Korporasi Pembangunan Desa to develop 4,000 acres of land in Telupid, Sandakan, Sabah into an oil palm plantation. Restructuring exercise to transfer all Sabah plantation operations to Kim Loong Resources Berhad.
1998 – Incorporation of Kim Loong Corporation Sdn Bhd (“KLC”) by SKL to enter into a JV to develop 17,731 acres of land into oil palm plantation and to erect new palm oil mill in Sook, Keningau, Sabah.
1999 – As part of the listing restructuring exercise, KLPO group (milling operations at Kota Tinggi, Johor) and KLC (the plantation and milling operations at Sook, Keningau, Sabah) were transferred to Kim Loong Resources Berhad.
2000 – Kim Loong Resources Berhad was listed on the Main Board of the Kuala Lumpur Stock Exchange (now Bursa Malaysia Securities Berhad)
2004 – Entered into a Joint Venture to develop 2,702 acres of land in Kota Tinggi, Johor. Capacity
of Keningau Mill in Sabah was successfully expanded to 45 MT of FFB per hour.
2010 – Expanded into Sarawak by acquiring a joint venture company with Pelita Holdings Sdn Bhd to develop Native Land with estimated plantable area of 6,300 Ha in Sri Aman Division.
2018 – Corporate Exercise involving Share Split (1 existing ordinary share to 3 Subdivided
Shares) and Bonus Issue of Warrants (1 Warrant for every 20 Subdivided Shares) in April 2018.
| YE 31-Jan | 2020 | 2021 | 2022 | 2023 | 2024 | 2025 | 2026 |
| Revenue (RM mil) | 679.6 | 971.7 | 1,702.7 | 1,908.3 | 1,526.1 | 1,684.0 | 1,823.9 |
| Operating Profit (RM mil) | 61.1 | 145.6 | 212.3 | 254.8 | 234.8 | 258.6 | 278.7 |
| Profit Before Tax (RM mil) | 60.4 | 144.6 | 210.3 | 252.4 | 232.3 | 255.3 | 271.4 |
| Net Profit After Tax (RM mil) | 41.1 | 94.9 | 136.6 | 162.3 | 147.8 | 161.4 | 168.5 |
| EPS (RM) | 0.044 | 0.102 | 0.144 | 0.168 | 0.153 | 0.166 | 0.172 |
| DPS (RM) | 0.03 | 0.07 | 0.10 | 0.10 | 0.10 | 0.10 | 0.11 |
| DPS Special (RM) | 0 | 0.03 | 0.04 | 0.05 | 0.03 | 0.05 | 0.03 |
| Shareholders Equity (RM mil) | 719.7 | 749.3 | 809.8 | 834.4 | 864.9 | 882.0 | 939.5 |
| No of Shares (millions) | 935.4 | 935.4 | 967.2 | 968.8 | 974.5 | 978.2 | 983.5 |
| Shareholders Equity Per Share | 0.77 | 0.80 | 0.84 | 0.86 | 0.89 | 0.90 | 0.96 |
| Share Price - Close (RM) | 1.26 | 1.36 | 1.7 | 1.79 | 2.04 | 2.37 | 2.40 |
| Op Profit + Div Received (RM mil) | 61.1 | 145.6 | 212.3 | 254.8 | 234.8 | 258.6 | 278.7 |
| Capital Employed (RM mil) | 578.2 | 555.5 | 575.0 | 612.3 | 613.1 | 636.7 | 617.0 |
| Return on Capital Employed (%) | 10.7% | 25.2% | 38.2% | 44.3% | 38.3% | 42.2% | 43.8% |
| Return on Equity (%) | 5.6% | 13.2% | 18.2% | 20.0% | 17.7% | 18.7% | 19.1% |
| Production Volume | |||||||
| Fresh Fruit Bunches (tonnes) | 260,512 | 276,634 | 265,037 | 286,987 | 329,597 | 310,212 | 330,021 |
| Crude Palm Oil (tonnes) | 247,659 | 280,493 | 311,752 | 330,968 | 317,607 | 314,738 | 342,720 |
| Palm Kernel (tonnes) | 60,119 | 69,073 | 75,373 | 81,763 | 77,197 | 75,534 | 81,239 |
SHARE TRADING SUMMARY CY2025
| Share Price - High | RM2.50 |
| Share Price - Low | RM2.12 |
| Share Price - Close @ 31/12/25 | RM2.35 |
| Average Daily Volume | 114,973 shares |
| Volume - High | 707,600 shares |
| Volume - Low | 0 shares |
| Total Annual Volume | 28,053,500 shares |
|
Annual Turnover (% of Share Capital) |
2.9% |
TOP SHAREHOLDERS
| As at 24 April 2026 | Direct | Indirect |
| Sharikat Kim Loong Sendirian Berhad | 63.42% | 0 |
| Gooi Seong Lim | 0.66% | 64.23 |
| Gooi Seong Heen | 0.61% | 63.81 |
| Gooi Seong Chneh | 0.56% | 63.81 |
| Gooi Seong Gum | 0.12% | 63.82 |
| Wilgain Prosperity Sdn Bhd | 0 | 63.42 |
| Eternal Profits Worldwide Sdn Bhd | 0 | 63.42 |
| Ascendant Capital Sdn Bhd | 0 | 63.42 |
| SG Gooi Holdings Sdn Bhd | 0 | 63.42 |
| Total | 65.4% | |
| Top 30 Shareholders | 77.38% |
Oil Palm Estates

Palm Oil Mills

FINANCIALS
| Year Ending (RM) |
2020 31-Jan |
2021 31-Jan |
2022 31-Jan |
2023 31-Jan |
2024 31-Jan |
2025 31-Jan |
2026 31-Jan |
| Revenue | 679,625,433 | 971,677,438 | 1,702,716,063 | 1,908,343,013 | 1,526,132,895 | 1,684,021,393 | 1,823,857,696 |
| Cost of Sales | (585,625,050) | (796,887,132) | (1,435,535,617) | (1,608,886,668) | (1,250,294,997) | (1,385,608,613) | (1,499,089,487) |
| Gross Profit | 94,000,383 | 174,790,306 | 267,180,446 | 299,456,345 | 275,837,898 | 298,412,780 | 324,768,209 |
| Other Operating Income | 16,534,496 | 19,405,836 | 12,921,276 | 13,529,258 | 17,581,691 | 25,090,094 | 25,467,829 |
| Distribution Expenses | (18,339,887) | (18,312,756) | (21,194,392) | (21,567,638) | (22,181,514) | (24,895,432) | (26,896,069) |
| Administrative Expenses | (25,478,074) | (26,525,146) | (30,379,679) | (31,500,684) | (32,455,088) | (37,766,758) | (41,960,204) |
| Other Operating Expenses | (5,618,998) | (3,798,294) | (16,257,835) | (5,071,868) | (4,009,768) | (2,199,810) | (2,698,686) |
| Operating Profit/(Loss) | 61,097,920 | 145,559,946 | 212,269,816 | 254,845,413 | 234,773,219 | 258,640,874 | 278,681,079 |
| Finance Costs | (709,028) | (1,008,453) | (1,939,026) | (2,402,269) | (2,489,648) | (3,312,402) | (7,311,880) |
| Profit Before Tax | 60,388,892 | 144,551,493 | 210,330,790 | 252,443,144 | 232,283,571 | 255,328,472 | 271,369,199 |
| Tax Expense | (15,399,566) | (33,930,220) | (43,288,950) | (52,758,757) | (54,424,780) | (60,745,689) | (65,215,233) |
| Profit After Tax | 44,989,326 | 110,621,273 | 167,041,840 | 199,684,387 | 177,858,791 | 194,582,783 | 206,153,966 |
| Non-Controlling Interests | (3,927,894) | (15,729,924) | (30,462,006) | (37,427,351) | (30,107,742) | (33,160,830) | (37,652,414) |
| Net Profit attributable to Owners | 41,061,432 | 94,891,349 | 136,579,834 | 162,257,036 | 147,751,049 | 161,421,953 | 168,501,552 |
| Basic EPS (Sen) | 4.4 | 10.16 | 14.42 | 16.79 | 15.25 | 16.55 | 17.16 |
| Diluted EPS (Sen) | 4.4 | 10.15 | 14.4 | 16.75 | 15.22 | 16.52 | 17.15 |
KMLOONG Balance
| Year Ending 31 Jan (RM) | 2020 | 2021 | 2022 | 2023 | 2024 | 2025 | 2026 |
|---|---|---|---|---|---|---|---|
| Cash and Cash Equivalents | 243,120 | 337,972 | 410,790 | 399,869 | 418,796 | 524,240 | 593,850 |
| Inventories | 27,211 | 20,464 | 33,422 | 58,196 | 43,024 | 38,591 | 64,838 |
| Trade and Other Receivables | 40,318 | 48,791 | 58,216 | 48,058 | 43,148 | 51,225 | 52,780 |
| Property, Plant and Equipment | 260,119 | 255,814 | 264,944 | 271,656 | 275,084 | 289,419 | 304,400 |
| Right-of-Use Assets | 292,294 | 287,375 | 337,499 | 331,652 | 325,805 | 323,721 | 318,530 |
| Bearer Plants and Biological Assets | 85,545 | 94,648 | 138,828 | 139,767 | 136,631 | 138,970 | 141,918 |
| Other Assets | 26,398 | 41,416 | 20,644 | 14,410 | 14,236 | 6,117 | 8,903 |
| Total Assets | 975,006 | 1,086,480 | 1,264,343 | 1,263,609 | 1,256,724 | 1,372,284 | 1,485,218 |
| Borrowings | 14,259 | 49,308 | 66,367 | 58,437 | 51,454 | 160,490 | 140,344 |
| Trade and Other Payables | 63,931 | 69,479 | 132,346 | 98,976 | 91,753 | 93,150 | 112,416 |
| Deferred Tax Liabilities | 85,883 | 90,044 | 91,318 | 93,115 | 91,327 | 97,599 | 105,294 |
| Other Liabilities | 3,907 | 33,491 | 54,887 | 59,381 | 41,766 | 20,641 | 56,649 |
| Total Liabilities | 167,980 | 242,322 | 344,918 | 309,909 | 276,299 | 371,880 | 414,703 |
| Net Assets | 807,026 | 844,158 | 919,425 | 953,700 | 980,424 | 1,000,404 | 1,070,514 |
| Share Capital | 318,433 | 318,437 | 369,304 | 371,865 | 380,891 | 386,799 | 398,010 |
| Retained Earnings | 402,924 | 432,463 | 447,256 | 464,148 | 485,149 | 492,937 | 534,693 |
| Other Reserves | -1,626 | -1,626 | -6,757 | -1,626 | -1,124 | 2,275 | 6,748 |
| Equity attributable to Owners | 719,732 | 749,274 | 809,803 | 834,387 | 864,917 | 882,010 | 939,451 |
| Non-Controlling Interests | 87,294 | 94,884 | 109,622 | 119,313 | 115,507 | 118,394 | 131,063 |
| Total Equity | 807,026 | 844,158 | 919,425 | 953,700 | 980,424 | 1,000,404 | 1,070,514 |
| No of Shares | 935,413,332 | 935,415,732 | 967,221,320 | 968,822,321 | 974,466,452 | 978,160,043 | 983,502,153 |
| Year Ending (RM) |
2020 31-Jan |
2021 31-Jan |
2022 31-Jan |
2023 31-Jan |
2024 31-Jan |
2025 31-Jan |
2026 31-Jan |
| Net Cash from Operating Activities | 103,123,247 | 157,878,662 | 225,745,736 | 213,010,795 | 234,887,622 | 248,184,643 | 253,658,693 |
| Acquisition of Property Plant & Equipment | (65,572,573) | (55,091,131) | (99,522,313) | (63,815,866) | (44,458,005) | (54,593,867) | (41,256,925) |
| Disposal of Property Plant, Equipment & Right-of-Use | 961,510 | 18,958 | 742,573 | 803,192 | 1,826,321 | 3,524,582 | 96,212 |
| Free Cash Flow | 38,512,184 | 102,806,489 | 126,965,996 | 149,998,121 | 192,255,938 | 197,115,358 | 212,497,980 |
| Dividends paid to Non-Controlling Interest | (8,855,000) | (8,140,000) | (14,956,000) | (27,736,000) | (34,150,000) | (28,088,000) | (28,298,000) |
| Free Cash Flow attributable to Owners | 29,657,184 | 94,666,489 | 112,009,996 | 122,262,121 | 158,105,938 | 169,027,358 | 184,199,980 |
Cash Earnings & Utilization Metrics
| YE 31-Jan | 2020 | 2021 | 2022 | 2023 | 2024 | 2025 | 2026 |
| EBIT (RM) | 61,097,920 | 145,559,946 | 212,269,816 | 254,845,413 | 234,773,219 | 258,640,874 | 278,681,079 |
| Net Cash from Operating Activities (RM) | 103,123,247 | 157,878,662 | 225,745,736 | 213,010,795 | 234,887,622 | 248,184,643 | 253,658,693 |
| Free Cash Flow attributable to Owners (RM) | 29,657,184 | 94,666,489 | 112,009,996 | 122,262,121 | 158,105,938 | 169,027,358 | 184,199,980 |
| Net Investments (RM) | (14,697,609) | (10,700,592) | 4,690,738 | (60,956,810) | (73,368,961) | (35,913,419) | (55,255,311) |
| Dividends Paid to Owners (RM) | (56,016,440) | (37,344,293) | (104,838,654) | (135,312,099) | (145,328,363) | (175,549,529) | (98,246,465) |
| Residual Cash Flow (RM) | (41,056,865) | 46,621,604 | 11,862,080 | (74,006,788) | (60,591,386) | (42,435,590) | 30,698,204 |
| Net Cash (RM) | 228,860,839 | 288,664,094 | 344,423,058 | 341,431,790 | 367,342,232 | 363,749,772 | 453,504,605 |
| Free Cash Flow per share (RM) | 0.032 | 0.101 | 0.116 | 0.126 | 0.162 | 0.173 | 0.187 |
| Net Capex (RM) | 64,611,063 | 55,072,173 | 98,779,740 | 63,012,674 | 42,631,684 | 51,069,285 | 41,160,713 |
| Net Capex / EBIT (%) | 105.8% | 37.8% | 46.5% | 24.7% | 18.2% | 19.7% | 14.8% |
| Net Capex / Operating Cash Flow (%) | 62.7% | 34.9% | 43.8% | 29.6% | 18.1% | 20.6% | 16.2% |
STAKEHOLDERS
Directors & CEO Remuneration
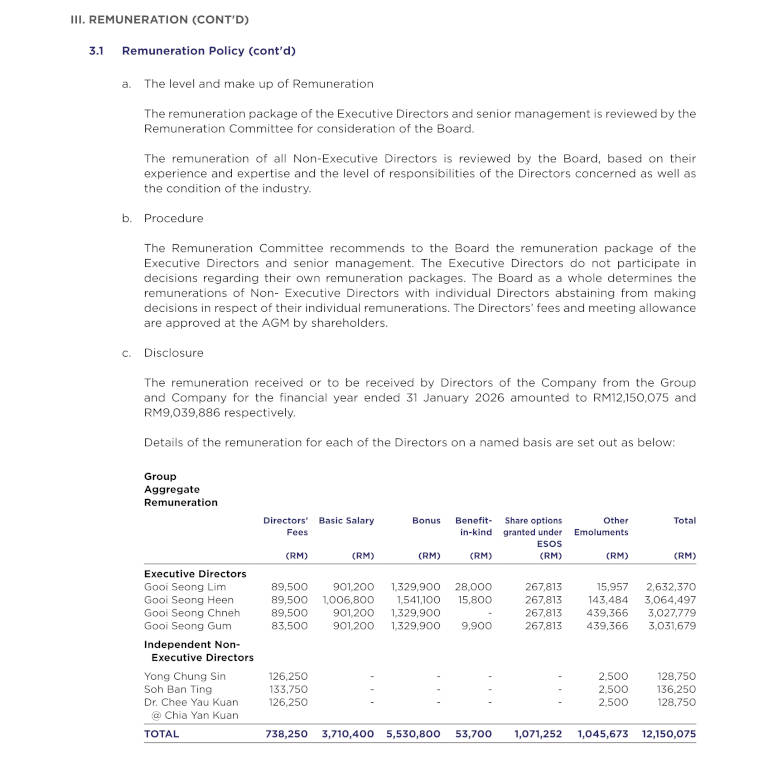
Executive & CEO: RM11.76 million
Non-Executive: RM0.39 million
CEO: RM3.06 million

Executive & CEO: RM10.35 million
Non-Executive: RM0.37 million
CEO: RM2.91 million

Executive & CEO: RM9.43 million
Non-Executive: RM0.29 million
CEO: RM2.64 million

Executive & CEO: RM9.58 million
Non-Executive: RM0.35 million
CEO: RM4.0 million

Executive & CEO: RM9.10 million
Non-Executive: RM0.29 million
CEO: RM2.49 million

Executive & CEO: RM8.53 million
Non-Executive: RM0.30 million
CEO: RM2.34 million