AMMB HOLDINGS BERHAD (AMBANK 1015)
SNAPSHOT
In 1977, AMDB acquired a 70.0% shareholding in Malaysian Industrial Finance Company Limited, which was later renamed Arab-Malaysian Finance Berhad (AMFB). In 1982 Tan Sri Azman Hashim acquired AMDB which in turn acquired the remaining 30% shareholding of AMFB it did not own. AMDB was renamed Arab-Malaysian Merchant Bank Berhad and became the first merchant bank to be listed on the Kuala Lumpur Stock Exchange on 1988.
| YE 31-Mar | 2021 | 2022 | 2023 | 2024 | 2025 |
| Profit Before Tax (RM mil) | (3,484) | 1,805 | 2,255 | 1,694 | 2,587 |
| Net Profit After Tax (RM mil) | (3,712) | 1,503 | 1,735 | 1,868 | 2,001 |
| EPS (RM) | (1.27) | 0.46 | 0.52 | 0.56 | 0.61 |
| DPS (RM) | 0.00 | 0.05 | 0.18 | 0.23 | 0.30 |
| Net Loans (RM mil) | 112,478 | 118,066 | 128,243 | 132,102 | 137,130 |
| Customer Deposits (RM mil) | 120,543 | 122,593 | 130,315 | 142,381 | 141,547 |
| Shareholders Funds (RM mil) | 14,641 | 16,760 | 18,135 | 19,441 | 20,621 |
| Net Assets / Total Assets (%) | 9.2% | 10.3% | 9.2% | 9.9% | 10.4% |
| NTA per share (RM) | 4.38 | 4.63 | 5.32 | 5.74 | 6.08 |
| No of Shares (millions) | 3,014 | 3,314 | 3,314 | 3,314 | 3,314 |
| Share Price – Close (RM) | 2.93 | 3.71 | 3.75 | 4.19 | 5.60 |
| Financial Ratios (%) | |||||
| Return on Av Equity | -22.3% | 9.6% | 9.9% | 9.9% | 10.0% |
| Cost to Income Ratio | 47.3% | 45.3% | 44.1% | 45.0% | 45.6% |
| Loan to Deposit Ratio | 95.2% | 97.9% | 99.9% | 94.2% | 98.1% |
| Impaired Loans | 2.0% | 1.6% | 1.5% | 1.5% | 1.3% |
| Net Interest / Total Interest Income | 50.3% | 56.5% | 45.8% | 35.2% | 38.3% |
| Interest Income / Av Net Loans | 3.81% | 3.53% | 4.04% | 4.66% | 4.57% |
SHARE TRADING SUMMARY CY2025
| Share Price - High | RM6.52 |
| Share Price - Low | RM4.93 |
| Share Price - Close @ 31/12/25 | RM6.50 |
| Average Daily Volume | 7,000,373 shares |
| Volume - High | 39,336,398shares |
| Volume - Low | 847,900 shares |
| Total Annual Volume | 1,708,090,997shares |
|
Annual Turnover (% of Share Capital) |
51.5% |
TOP SHAREHOLDERS
| As at 30 June 2025 | Direct | Deemed |
| Amcorp Group Berhad | 11.84% | - |
| Clear Goal Sdn Bhd | - | 11.84% |
| Tan Sri Azman Hashim | - | 11.84% |
| Employees Provident Fund Board | 12.47% | - |
| Total | 24.31% |
KEY STRENGTHS
FY2025 SEGMENT EARNINGS (RM mil)
| Retail Banking | 230 |
| Business Banking | 1,093 |
| Corporate Banking | 450 |
| Treasury Markets | 642 |
| Investment Banking | 66 |
| Funds Management | 83 |
| Insurance | 101 |
| Group Funding | (78) |
| Profit Before Tax (FY2025) | 2,587 |
LOAN SEGMENTATION
FINANCIALS
|
(RM '000) Year Ending |
2023 31-Mar |
2024 31-Mar |
2025 31-Mar |
| Interest Income | 4,975,955 | 6,070,788 | 6,149,269 |
| Interest Expense | (2,695,320) | (3,933,990) | (3,791,237) |
| Net Interest | 2,280,635 | 2,136,798 | 2,358,032 |
| Islamic Banking Income | 1,301,270 | 1,315,722 | 1,350,637 |
| Other Operating Income | 956,404 | 1,102,931 | 1,112,415 |
| Other Operating Expenses | (1,999,092) | (2,051,676) | (2,197,798) |
| Impairment on Loans, Advances and Financing | (421,846) | (696,327) | (224,044) |
| Impairment on Other Assets | (10,173) | (127,278) | 9,241 |
| Writebacks & Other Recoveries | 78,381 | 53,901 | 70,923 |
| Provision for Restructuring Expenses | 0 | (80,000) | 0 |
| Share of results of Associates & JV | 69,862 | 40,027 | 107,846 |
| Profit Before Tax from Continuing Operations | 2,255,441 | 1,694,098 | 2,587,252 |
| Tax Expense | (513,063) | 148,283 | (585,886) |
| Profit After Tax from Continuing Operations | 1,742,378 | 1,842,381 | 2,001,366 |
| Profit Before Tax from Discontinued Operations | (84,952) | 51,115 | 0 |
| Tax Expense on Discontinued Operations | 18,879 | 0 | 0 |
| Profit After Tax from Discontinued Operations | (66,073) | 51,115 | 0 |
| Profit After Tax | 1,735,153 | 1,893,496 | 2,001,366 |
| Non-controlling Interests | (66,073) | (25,398) | (181) |
| Net Profit After Tax | 1,676,305 | 1,868,098 | 2,001,185 |
| EPS Basic/Diluted | 52.41 | 56.49 | 60.56 |
|
(RM '000) Year Ending |
2023 31-Mar |
2024 31-Mar |
2025 31-Mar |
| Net Loans | 128,242,605 | 132,102,117 | 137,130,068 |
| Cash | 8,521,940 | 6,493,099 | 6,759,126 |
| Deposits with FI | 176,604 | 0 | 0 |
| Fin Assets (FVPL) | 12,770,907 | 10,004,884 | 7,818,445 |
| Fin Assets (FVCI) | 25,610,733 | 26,391,171 | 25,447,763 |
| Fin Investments (Amortized) | 13,469,703 | 11,320,895 | 12,041,303 |
| Derivative Financial Instruments | 921,109 | 1,012,308 | 652,209 |
| Statutory Deposits | 2,446,547 | 2,612,713 | 2,774,414 |
| Intangible Assets | 510,644 | 431,294 | 458,690 |
| Right-of-use Assets | 229,770 | 180,781 | 126,308 |
| Associates & JV | 1,631,600 | 1,439,742 | 1,478,914 |
| Other Assets | 3,008,469 | 4,774,749 | 4,356,348 |
| Total Assets | 197,540,631 | 196,763,753 | 199,043,588 |
| Deposits from Customers | 130,315,080 | 142,381,215 | 141,547,041 |
| Deposits from Financial Institutions | 11,462,245 | 8,901,924 | 7,579,328 |
| Investment accounts of customers | 16,474 | 14,059 | 12,480 |
| Obligations on Securities sold under Repurchase Agmts | 16,466,674 | 6,328,335 | 5,951,549 |
| Recourse Obligations on loans sold to Cagamas | 9,915,040 | 7,480,020 | 6,555,071 |
| Derivative Financial Liabilities | 964,319 | 1,021,693 | 608,236 |
| Debt Securities & Borrowings | 6,567,333 | 6,912,990 | 12,116,649 |
| Other Liabilities | 3,697,557 | 4,281,684 | 4,051,515 |
| Total Liabilities | 179,404,722 | 177,321,920 | 178,421,869 |
| NET ASSETS | 18,135,909 | 19,441,833 | 20,621,719 |
| Share Capital | 6,376,240 | 6,376,240 | 6,376,240 |
| Retained Profits | 10,884,274 | 11,991,843 | 12,989,137 |
| Regulatory Reserves | 211,707 | 245,196 | 352,522 |
| Treasury Shares | (28,579) | (29,079) | (53,522) |
| Other Reserves | 691,403 | 856,605 | 956,433 |
| Shareholder Funds | 18,135,045 | 19,440,805 | 20,620,810 |
| Non-controlling Interests | 864 | 1,028 | 909 |
| TOTAL EQUITY | 18,135,909 | 19,441,833 | 20,621,719 |
| No of Shares | 3,314,185 | 3,314,185 | 3,314,185 |
| Weighted Av Shares | 3,310,645 | 3,307,218 | 3,304,488 |
| Share Price | 3.75 | 4.19 | 5.60 |
|
(RM '000) Year Ending |
2023 31-Mar |
2024 31-Mar |
2025 31-Mar |
| PBT from Continuing Operations | 2,255,441 | 1,694,098 | 2,587,252 |
| PBT from Discontinued Operations | (84,952) | 51,115 | 0 |
| Associates | (69,862) | (40,027) | (107,846) |
| Depreciation of PPE | 53,071 | 49,355 | 44,287 |
| Depreciation of ROU Assets | 77,010 | 67,728 | 65,175 |
| Amortisation of Intangible Assets | 84,754 | 51,019 | 38,258 |
| Impairment / ECL on Loans, Adv & Financing | 732,186 | 988,804 | 509,417 |
| Writeback of ECL | (77,937) | (51,087) | (71,692) |
| Net Loss/(Gain) on sale of Fin Assets (FVPL) | (45,990) | (56,381) | (100,718) |
| Net Loss/(Gain) on sale of Fin Investm (FVCI) | (211) | (27,311) | (32,943) |
| Net Loss/(Gain) on redemption of Fin Investm (A) | 0 | (96,228) | (54,516) |
| Revaluation (Gain)/Loss on Fin Assets (FVPL) | 27,145 | (267,099) | 231,976 |
| Allowance/(Writeback) for Impairment on Other Assets | 115,981 | 111,943 | (17,802) |
| Unrealised Loss on Foreign Exchange | 0 | 0 | (525) |
| Other Items | (65,631) | (131,391) | (41,929) |
| Operating profit before Working Capital changes | 3,001,005 | 2,344,538 | 3,048,394 |
| Changes in Operating Assets | |||
| Loans, Advances and Financing | (10,812,595) | (4,805,916) | (5,527,359) |
| Fin Assets at FV through P&L | (9,099,830) | 3,281,600 | 2,117,415 |
| Statutory deposits with Central Banks | (2,070,024) | (166,166) | (161,701) |
| Insurance Contract Assets | 15,939 | 0 | 0 |
| Change in Other Assets | 225,977 | (1,202,053) | 343,024 |
| Changes in Operating Liabilities | |||
| Deposits from Customers | 7,722,230 | 12,066,135 | (834,174) |
| Deposits from Financial Institutions | 1,532,458 | (2,594,678) | (1,359,668) |
| Investment Account of Customers | (361,387) | (2,414) | (1,579) |
| Obligations in Securities Sold under Repurchase Agmt | 14,883,956 | (10,138,339) | (376,786) |
| Recourse Obligation on Loans sold to Cagamas | 1,540,018 | (2,435,020) | (924,949) |
| Fin Liabilities at FVPL | 0 | 68,022 | 140,853 |
| Insurance Contract Liabilities | (39,909) | 0 | 0 |
| Term Funding | 269,875 | 242,055 | 5,086,910 |
| Change in Other Liabilities | (237,833) | 607,794 | (156,589) |
| Income Tax Expense and Zakat Paid | (610,349) | (401,632) | (486,304) |
| Other Items | 9,254 | 0 | 0 |
| Cash Flow from Operating Activities | 5,968,785 | (3,136,074) | 907,487 |
| Purchase PPE | (57,510) | (29,139) | (41,125) |
| Disposal PPE | 20,588 | 116 | 1,088 |
| Net Sale/(Purchase) of Fin Investments | (11,249,815) | 1,620,328 | 388,719 |
| Purchase of Intangible Assets | (67,175) | (85,663) | (48,284) |
| Disposal of Subsidiaries | 1,126,025 | 0 | 0 |
| Dividends from Associates & JV | 5,633 | 122,076 | 76,300 |
| Dividends from Fin Investm Portfolio & Others | 3,139 | 2,591 | 4,406 |
| Purchase of Treasury Shares | (43,744) | (22,704) | (44,716) |
| Other Items | 0 | 0 | (14,500) |
| Cash Flow from Investing Activities | (10,262,859) | 1,607,605 | 321,888 |
| Dividends paid to Shareholders | (364,172) | (605,228) | (889,386) |
| Dividends paid to Non-Controlling Interests | (1,981) | (150) | (300) |
| Repayment of Lease Liabilities | (80,423) | (70,903) | (68,967) |
| Return of Capital to Non-Controlling Interests | (1,075,993) | 0 | 0 |
| Other Items | 0 | (2,116) | (3,310) |
| Cash Flow from Financing Activities | (1,522,569) | (678,397) | (961,963) |
| Net Cash Flow | (5,816,643) | (2,206,866) | 267,412 |
| Effects of Exchange Rate Changes | 146 | 581 | (58) |
Income & Cost Metrics
| Year Ending |
2023 31-Mar |
2024 31-Mar |
2025 31-Mar |
| (RM'000) | |||
| Interest Income | 4,975,955 | 6,070,788 | 6,149,269 |
| Interest Expense | (2,695,320) | (3,933,990) | (3,791,237) |
| Net Interest | 2,280,635 | 2,136,798 | 2,358,032 |
| Islamic Banking Income | 1,301,270 | 1,315,722 | 1,350,637 |
| Other Operating Income* | 956,404 | 1,102,931 | 1,112,415 |
| Total Operating Income | 4,538,309 | 4,555,451 | 4,821,084 |
| Operating Cost** | (1,999,092) | (2,051,676) | (2,197,798) |
| Cost to Income Ratio (%) | 44.0% | 45.0% | 45.6% |
| Year Ending |
2023 31-Mar |
2024 31-Mar |
2025 31-Mar |
| *Other Operating Income (RM'000) | |||
| Fee & Commission Income (Net) | 596,983 | 652,963 | 660,409 |
| Realised Gain/(Loss) on Fin Instruments | 23,129 | (223,224) | 444,131 |
| Unrealised Gain/(Loss) on Fin Instruments | (1,455) | 268,979 | (232,360) |
| Dividend Income | 28,743 | 39,263 | 60,395 |
| Foreign Exchange Gain/(Loss) | 263,723 | 327,921 | 147,001 |
| Other Income | 45,281 | 37,029 | 32,839 |
| Total | 956,404 | 1,102,931 | 1,112,415 |
| Annual Report Ref (PDF Page) |
Note 34 & 35 (p136-138) |
Note 53 (p223-225) |
Note 35 to 36 (p115-116) |
| Year Ending |
2023 31-Mar |
2024 31-Mar |
2025 31-Mar |
| **Operating Cost (RM'000) | |||
| Personnel Costs | (1,317,681) | (1,340,119) | (1,457,399) |
| Establishment Costs | (471,676) | (474,330) | (493,083) |
| Marketing Expenses | (70,538) | (72,549) | (71,329) |
| Administration and General Expenses | (139,197) | (164,678) | (175,987) |
| Total Operating Cost | (1,999,092) | (2,051,676) | (2,197,798) |
| Annual Report Ref (PDF Page) | Note 55 (p274) | Note 35 (p116) | Note 36 (p116) |
| Profit Before Tax (RM'000) | 2,255,441 | 1,694,098 | 2,587,252 |
| Personnel Costs / Profit Before Tax (%) | 58.4% | 79.1% | 56.3% |
| Personnel Costs / Operating Cost (%) | 65.9% | 65.3% | 66.3% |
STAKEHOLDERS
Directors & CEO Remuneration
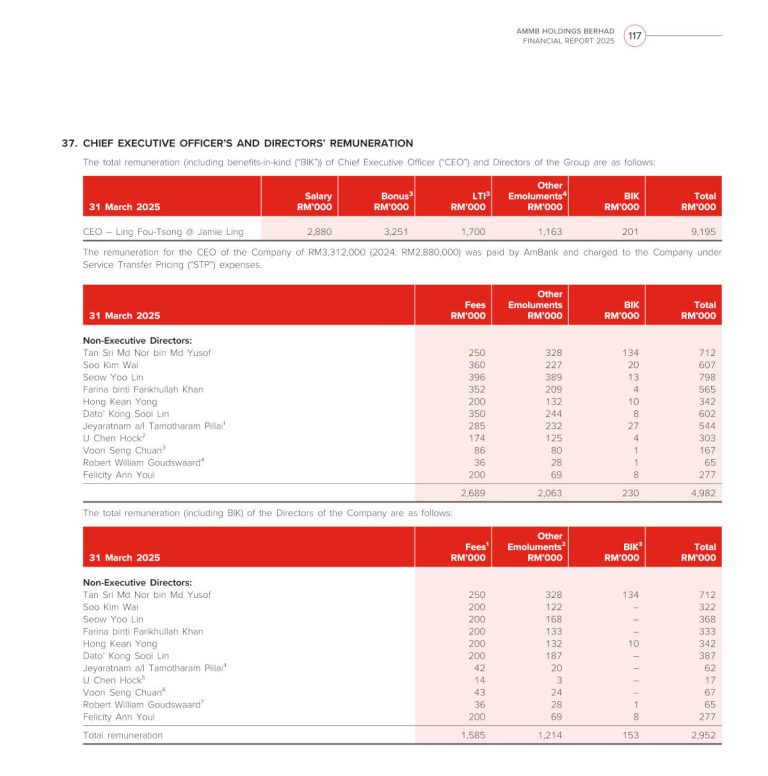
Executive & CEO: RM9.2 million
Non-Executive: RM5.0 million
CEO: RM9.2 million
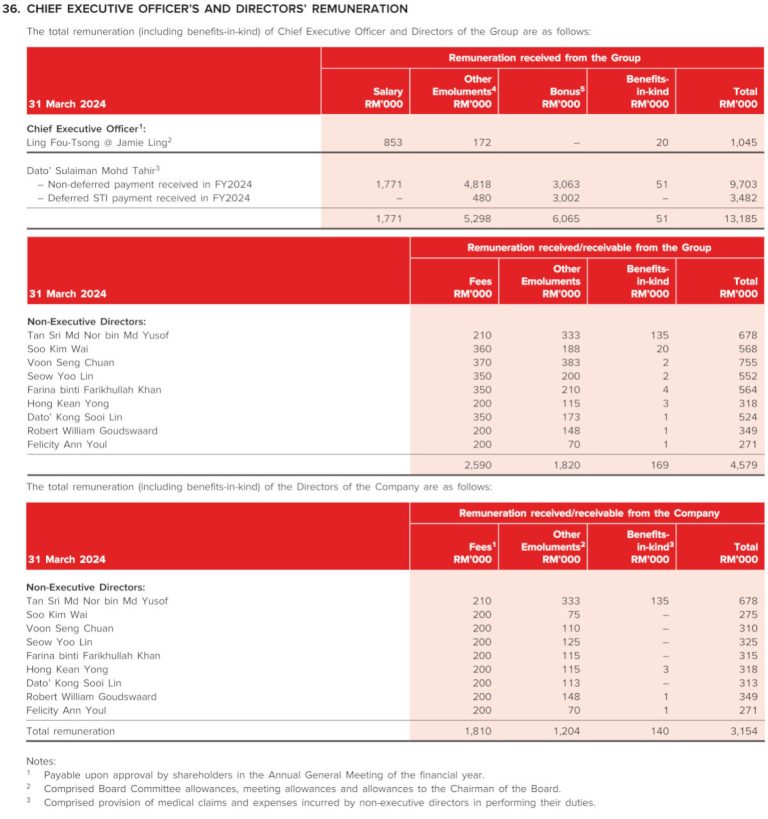
Executive & CEO: RM14.2 million
Non-Executive: RM4.6 million
CEO: RM14.2 million
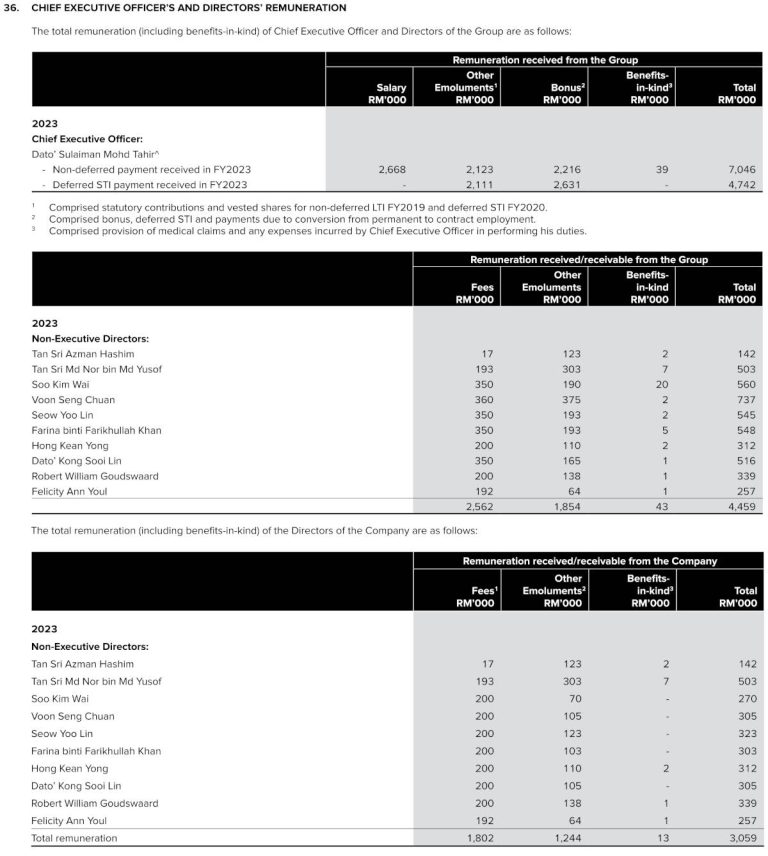
Executive & CEO: RM11.8 million
Non-Executive: RM4.5 million
CEO: RM11.8 million
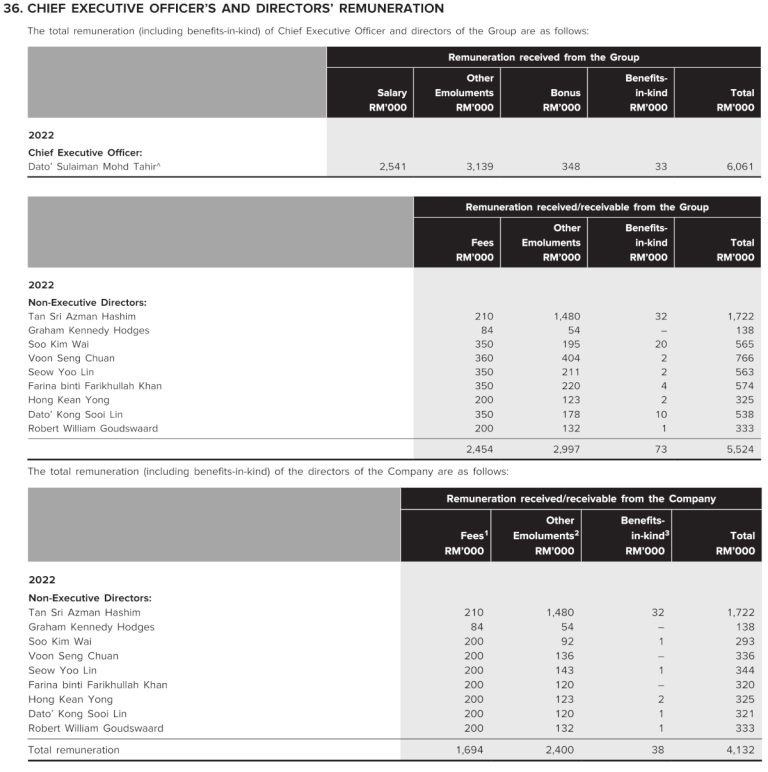
Executive & CEO: RM6.1 million
Non-Executive: RM5.5 million
CEO: RM6.1 million
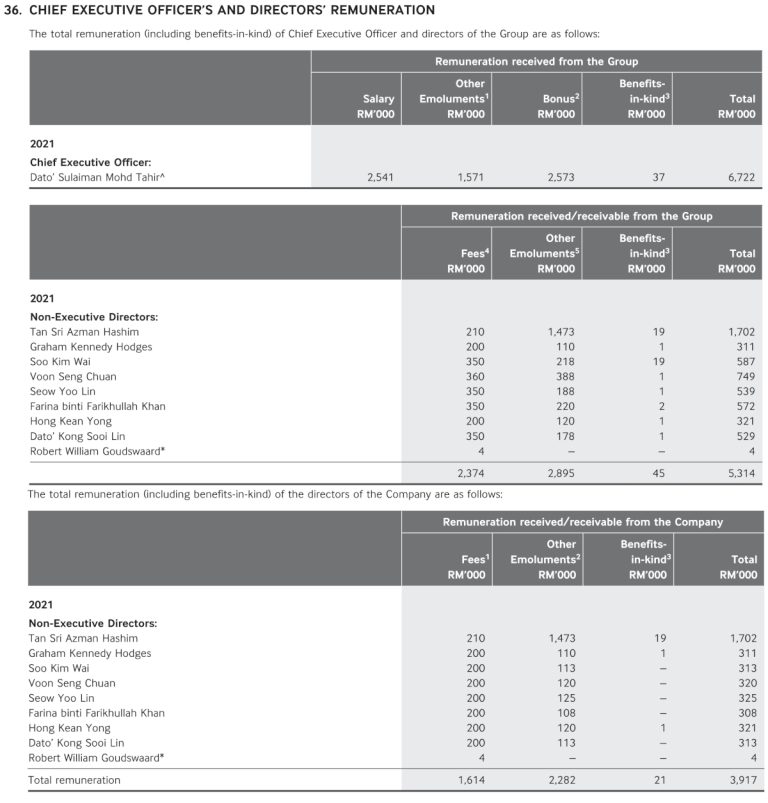
Executive & CEO: RM6.7 million
Non-Executive: RM5.3 million
CEO: RM6.7 million
Directors & CEO Interests
CORPORATE DEVELOPMENTS
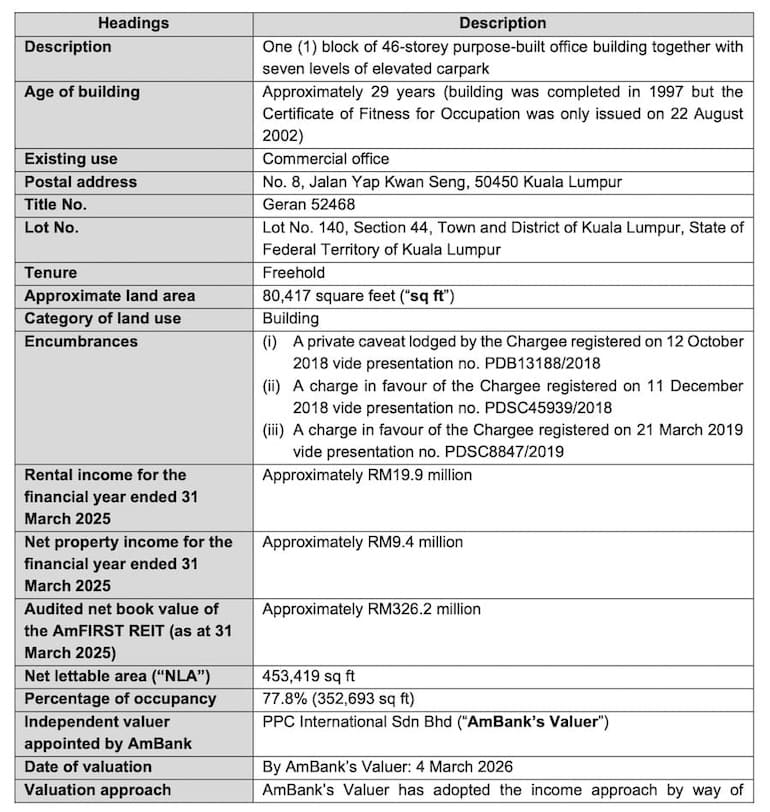
AMBANK to acquire Menara Ambank from AmFIRST REIT for RM331 million
AMMB Holdings Bhd (AMBANK) has proposed to acquire Menara AmBank on Jalan Yap Kwan Seng for RM331 million cash in a related-party transaction in a move to secure long-term office space and mitigate potential rental increase costs.
The 46-storey freehold office tower has an occupancy rate of 77.8% with AMBANK as the anchor tenant occupying 65.6% of the space. Other tenants incude Summer Healthcare Group Sdn Bhd, Horeb Services Sdn Bhd, Samsung Engineering (M) Sdn Bhd and MBf Protection Services Sdn Bhd.
AMBANK will assume the existing tenancies and licences, which account for about 12.2% of the building’s net lettable area. The remaining vacant space provides flexibility for future expansion or consolidation.
Based on a net lettable area of 453,419 sq ft, the acquisition price works out to be RM730 per square feet. The building was completed in 1997 has 557 car parking bays.
In its statement, the banking group said that “Ownership of Menara AmBank allows AmBank to secure its long-term office tenure and also potentially mitigate increases in costs and expenses incurred in connection with its occupation of Menara AmBank.”
AMBANK is purchasing the property from AmFIRST REIT which had acquired the property in December 2006 for RM230.2 million. The property achieved a Rental Income of RM19.9 million and Net Property Income of RM9.4 million for AmFIRST REIT’s financial year ending 31/3/25. Based on the purchase price of RM331 million, this represents a gross and net yield of 6.0% and 2.8% respectively.
Sarawak Government to engineer Ambank and Affin Merger?
Media reports on 14/4/25 suggested that the Sarawak government had approached major shareholder Tan Sri Azman Hashim to express interest in buying his shares in AMMB Holdings Berhad. Azman is currently the second largest shareholder of the banking group with an effective stake of 11.8 percent, behind EPF’s stake of around 15%. An article in the NST suggests that Sarawak may attempt to engineer a merger between AMMB and Affin in which it holds a 31.3% stake, with Affin to lead the merged entity.
However Sarawak Premier Abang Johari dismissed the reports as mere speculation, saying that Sarawak had not sent any state government representative to discuss the matter with AmBank Group. Considering the wording of the Premier’s reply, this does not preclude the possibility of a private party trying to negotiate a deal for Sarawak although the likelihood of Tan Sri Azman Hashim selling out at the current share price level is extremely low. AMMB’s share price had reached a high of almost RM8.00 during 2013 during which its Net Profit was on an upward trajectory reaching RM2.0 billion just over a year later. Although earnings had since come off, AMMB’s prospects are currently very positive judging from the number of BUY calls with analysts expecting AMMB to scale new heights in terms of profitability and dividend payout. AMMB has a much better track record than Affin especially in terms of dividend payout and unlike Affin’s major shareholders previously, Tan Sri Azman Hashim is not under any financial pressure to sell. He has been instrumental to AMMB’s growth from its humble beginnings and for him to sell now would yield a very mediocre result for his life’s work and AMMB’s success and could only be because of personal reasons, or political pressure.(Source: New Straits Times, TheEdge)
Ambank unveiled its Winning Together (WT29) strategy in June 2024
Ambank unveiled its Winning Together (WT29) strategy in June 2024 CEO Jamie Ling and his team unveiled that for the financial year ending March 31, 2025 it has set out three financial targets to be achieved by end of FY2029:
- Improve its dividend payout ratio to 50%-60% (from 40% in FY2024), placing it in the top quartile among peers;
- Lower its cost-to-income ratio to 40% from 44.2%;
- Generate a Return on Assets of 1.1% (from 0.97%), translating into a Return on Equity (ROE) of 11% to 12%.,?
(Source: TheEdge)