HONG LEONG BANK BERHAD (HLBANK 5819)
SNAPSHOT
Hong Leong Bank is the fourth largest bank in Malaysia in terms of market capitalisation, behind Maybank, Public Bank and CIMB Group. It is slightly behind RHB Bank in terms of Net Loans and Customer Deposits. Hong Leong Bank’s history dates back to 1905 in Kuching where it was established as Kwong Lee Mortgage and Remittance Company by brothers Lam Jee Chew and Lam Song Kee. Its West Malaysia presence experienced a boost with the entry of the MUI Group as a major shareholder in 1982. Subsequently, Hong Leong Financial Group Bhd (previously Hong Leong Credit Bhd) acquired the bank from MUI Group in 1994 after which it came under the Hong Leong umbrella.
In 2011, Hong Leong Bank acquired EON Bank and solidified its presence in Malaysia’s retail banking sector. In July 2008, it acquired a 19.99% stake in Bank of Chengdu (BoCD) for RM877.5 million. This stake was later diluted to 18% after BoCD was listed on the Shanghai Stock Exchange on 31 Jan 2018, and diluted to 17.8% in early 2025 following the conversion of BoCD’s convertible bonds into ordinary shares.
1934 – Incorporated as Kwong Lee Bank Ltd
1964 – Oversea-Chinese Banking Corporation of Singapore (OCBC Bank) acquired a majority stake in the bank from the Lam family. Control of the bank passed on to OCBC (represented by Tan Sri Tan Chin Tuan) with some members of the Lam family remaining on board the bank’s management.
1977 – YAM Tunku Osman (a member of Johor’s royal family) came in as a shareholder of Kwong Lee Bank and acquired 30% of its share capital from both OCBC Bank and the Lam family. Members of the Lam family who continued to play a key role in the bank’s management include Lam Tin Yue and Lawrence Lam Kwok Fou, respectively son and grandson of co-founder Lam Song Kee.
1982 – Kwong Lee Bank was acquired by Malayan United Industries Berhad (MUI Group), a conglomerate controlled by Malaysian tycoon Tan Sri Khoo Kay Peng. It was renamed Malayan United Bank Berhad in 1983 and MUI Bank in 1989. Under the MUI banner, the bank grew from 11 to 35 branches within a span of 12 years.
1994 – MUI Group sold its stake in the bank to Hong Leong Credit Berhad (now Hong Leong Financial Group Berhad), which is part of the Hong Leong Group controlled by tycoon Tan Sri Quek Leng Chan. This followed after one of corporate Malaysia’s most colorful takeover tussles involving Khoo and Tan Sri Vincent Tan of Berjaya Corporation, with Hong Leong’s Quek breaking the stalemate when he emerged as the “white knight” to acquire nearly 100% of MUI Bank. MUI Bank was renamed Hong Leong Bank and listed on the Kuala Lumpur Stock Exchange on 17 October 1994.
1998 – Following the Asian financial crisis, Hong Leong Bank was initially not on the original list of 6 anchor banks proposed by Bank Negara Malaysia under its industry consolidation effort. After intensive lobbying, BNM’s list was expanded to 10 banks, and Hong Leong Bank was officially included an anchor banks.
2001 – Hong Leong Bank acquired Wah Tat Bank as part of its consolidation effort.
2008 – Hong Leong Bank made history by being the first Malaysian bank to enter China’s banking sector with an 18% strategic stake in Bank of Chengdu.
2011 – Hong Leong Bank merged with EON Bank and became the fifth-largest banking group in Malaysia.
| YE 30-Jun | 2021 | 2022 | 2023 | 2024 | 2025 |
| Profit Before Tax (RM mil) | 3,471 | 4,367 | 4,627 | 5,134 | 5,360 |
| Net Profit After Tax (RM mil) | 2,861 | 3,289 | 3,818 | 4,196 | 4,273 |
| EPS (RM) | 1.397 | 1.605 | 1.863 | 2.047 | 2.073 |
| DPS (RM) | 0.50 | 0.55 | 0.59 | 0.68 | 0.96 |
| Net Loans (RM mil) | 154,071 | 166,488 | 179,903 | 193,304 | 208,965 |
| Customer Deposits (RM mil) | 183,290 | 197,293 | 211,652 | 220,433 | 238,926 |
| Shareholders Funds (RM mil) | 29,459 | 30,989 | 33,987 | 37,294 | 39,287 |
| Net Assets / Total Assets (%) | 12.4% | 12.2% | 12.1% | 12.5% | 12.5% |
| NTA per share (RM) | 12.42 | 13.07 | 14.42 | 16.20 | 17.97 |
| No of Shares (millions) | 2,168 | 2,168 | 2,168 | 2,168 | 2,168 |
| Share Price – Close (RM) | 18.72 | 20.46 | 18.96 | 19.20 | 19.60 |
| Financial Ratios (%) | |||||
| Return on Av Equity | 10.1% | 10.9% | 11.8% | 11.8% | 11.2% |
| Cost to Income Ratio | 38.0% | 37.5% | 39.3% | 40.5% | 38.7% |
| Loan to Deposit Ratio | 85.0% | 85.3% | 85.8% | 88.4% | 87.9% |
| Impaired Loans | 1.1% | 1.0% | 1.0% | 0.8% | 0.5% |
| Net Interest / Total Interest Income | 64.1% | 68.2% | 50.0% | 43.5% | 44.9% |
| Interest Income / Av Net Loans | 3.61% | 3.44% | 4.26% | 4.71% | 4.42% |
SHARE TRADING SUMMARY CY2025
| Share Price - High | RM22.60 |
| Share Price - Low | RM18.42 |
| Share Price - Close @ 31/12/25 | RM22.14 |
| Average Daily Volume | 1,073,935 shares |
| Volume - High | 5,145,900 shares |
| Volume - Low | 94,300 shares |
| Total Annual Volume | 262,040,200 shares |
|
Annual Turnover (% of Share Capital) |
12.1% |
TOP SHAREHOLDERS
| As at 2 September 2025 | Direct | Indirect |
| Hong Leong Financial Group Bhd | 64.23% | 0.15% |
| Tan Sri Quek Leng Chan | 0.00% | 64.50% |
| Employees Provident Fund Board | 9.64% | - |
| Total | 73.87% |
Key Strengths
Hong Leong Bank (HLB) has seen its Net Profit grow from RM382 million in FY2004 to RM4.3 billion in FY2025, making it one of the fastest growing bank in Malaysia. Like Ambank, it is a formidable and key player in Business Banking which generates over RM1.5 billion of Profit Before Tax for the group. HLB has grown both organically and through smart corporate moves the most notable of which is its acquisition of EON Bank in 2011 and its investment in China’s Bank of Chengdu in 2008. Through this investment, its Associate Income has grown to well over RM1 billion from a relatively negligible amount previously. These deals, together with HLB’s highly regarded management team have yet again demonstrated the exemplary prowess and “Midas touch” of controlling shareholder Tan Sri Quek Leng Chan.
FY2025 SEGMENT EARNINGS (RM mil)
| Personal Financial Services | 1,961 |
| Business & Corporate Banking | 1,568 |
| Global Markets | 66 |
| International Operations | 1,222 |
| Other Operations | 1,160 |
| Intersegment Eliminations | (617) |
| Profit Before Tax (FY2025) | 5,360 |
LOAN SEGMENTATION
FINANCIALS
|
(RM '000) Year Ending |
2022 30-Jun |
2023 30-Jun |
2024 30-Jun |
2025 30-Jun |
| Interest Income | 5,505,696 | 7,370,454 | 8,677,088 | 8,774,986 |
| Interest income for Fin Assets at FV through P&L | 217,168 | 160,370 | 106,136 | 113,994 |
| Interest Expense | (1,967,533) | (3,846,739) | (4,961,438) | (4,901,454) |
| Net Interest | 3,755,331 | 3,684,085 | 3,821,786 | 3,987,526 |
| Islamic Banking Income | 904,785 | 963,368 | 985,948 | 1,159,833 |
| Other Operating Income | 937,292 | 1,038,056 | 963,286 | 1,250,671 |
| Other Operating Expenses | (2,098,376) | (2,233,282) | (2,338,876) | (2,479,199) |
| Impairment on Loans, Advances and Financing | (163,574) | (115,382) | 114,263 | 383,317 |
| Impairment on Other Assets | 851 | 306 | (1,100) | 282 |
| Share of results of Associates & JV | 1,030,491 | 1,289,480 | 1,588,940 | 1,465,511 |
| Profit Before Tax from Continuing Operations | 4,366,800 | 4,626,631 | 5,134,247 | 5,767,941 |
| Unusual Items (net of tax) | 0 | 0 | 0 | (407,602) |
| Tax Expense | (1,077,517) | (808,435) | (938,035) | (1,086,897) |
| Profit After Tax from Continuing Operations | 3,289,283 | 3,818,196 | 4,196,212 | 4,273,442 |
| Profit After Tax | 3,289,283 | 3,818,196 | 4,196,212 | 4,273,442 |
| Net Profit After Tax | 3,289,283 | 3,818,196 | 4,196,212 | 4,273,442 |
| EPS Basic (sen) | 160.6 | 186.4 | 204.7 | 207.3 |
| EPS Diluted (sen) | 160.5 | 186.3 | 204.7 | 208.5 |
|
(RM '000) Year Ending |
2023 30-Jun |
2023 30-Jun |
2024 30-Jun |
2025 30-Jun |
| Net Loans | 166,487,621 | 179,902,847 | 193,304,468 | 208,964,590 |
| Cash | 6,094,729 | 8,206,803 | 5,790,159 | 9,990,872 |
| Deposits with FI | 842,506 | 436,877 | 661,521 | 3,249,519 |
| Fin Assets (FVPL) | 7,244,482 | 5,654,937 | 3,415,191 | 7,990,797 |
| Fin Assets (FVCI) | 26,196,303 | 33,886,670 | 41,099,194 | 37,328,324 |
| Fin Investments (Amortized) | 32,358,414 | 31,194,065 | 31,152,156 | 26,704,377 |
| Derivative Financial Instruments | 1,863,300 | 2,168,424 | 1,362,654 | 2,258,499 |
| Statutory Deposits | 520,650 | 3,396,920 | 3,214,478 | 2,027,739 |
| Intangible Assets | 304,749 | 362,435 | 353,477 | 334,629 |
| Right-of-use Assets | 211,718 | 175,946 | 167,705 | 156,340 |
| Goodwill | 1,831,312 | 1,831,312 | 1,831,312 | 1,831,312 |
| Associates & JV | 6,455,474 | 8,712,976 | 9,639,404 | 9,210,641 |
| Other Assets | 3,920,119 | 3,920,242 | 5,797,353 | 4,570,485 |
| Total Assets | 254,331,377 | 279,850,454 | 297,789,072 | 314,618,124 |
| Deposits from Customers | 197,292,459 | 211,651,819 | 220,432,800 | 238,926,005 |
| Deposits from Financial Institutions | 6,322,250 | 9,593,826 | 11,370,939 | 9,935,753 |
| Investment accounts of customers | 2,668,408 | 2,250,513 | 2,166,534 | 2,269,059 |
| Obligations on Securities sold under Repurchase Agmts | 3,971,304 | 7,399,583 | 9,823,649 | 6,524,607 |
| Bills and Acceptances Payable | 241,361 | 211,431 | 282,547 | 276,499 |
| Recourse Obligations on loans sold to Cagamas | 1,623,937 | 2,972,220 | 3,277,003 | 2,512,996 |
| Derivative Financial Liabilities | 1,736,838 | 2,387,886 | 1,805,207 | 2,649,881 |
| Debt Securities & Borrowings | 0 | 0 | 549,912 | 806,413 |
| Subordinated Obligations | 1,502,206 | 1,501,750 | 1,500,545 | 1,901,515 |
| Capital Securities | 1,715,695 | 1,719,509 | 1,718,671 | 1,714,861 |
| Lease Liabilities | 210,981 | 178,928 | 171,369 | 319,340 |
| Other Liabilities | 6,056,962 | 5,996,337 | 7,395,808 | 7,494,219 |
| Total Liabilities | 223,342,401 | 245,863,802 | 260,494,984 | 275,331,148 |
| NET ASSETS | 30,988,976 | 33,986,652 | 37,294,088 | 39,286,976 |
| Share Capital | 7,739,063 | 7,739,063 | 7,739,063 | 7,739,063 |
| Retained Profits | 22,727,982 | 25,017,703 | 27,674,882 | 29,895,045 |
| Regulatory Reserves | 654,386 | 1,002,061 | 1,259,640 | 1,861,261 |
| Treasury Shares | (713,690) | (708,766) | (702,674) | (700,378) |
| Other Reserves | 581,235 | 936,591 | 1,323,177 | 491,985 |
| Shareholder Funds | 30,988,976 | 33,986,652 | 37,294,088 | 39,286,976 |
| TOTAL EQUITY | 30,988,976 | 33,986,652 | 37,294,088 | 39,286,976 |
| No of Shares | 2,167,718 | 2,167,718 | 2,167,718 | 2,167,718 |
| Weighted Av Shares | 2,048,093 | 2,048,753 | 2,049,487 | 2,050,018 |
| Share Price | 20.46 | 18.96 | 19.20 | 19.60 |
|
(RM '000) Year Ending |
2022 30-Jun |
2023 30-Jun |
2024 30-Jun |
2025 30-Jun |
| PBT from Continuing Operations | 4,366,800 | 4,626,631 | 5,134,247 | 5,767,941 |
| Associates | (1,030,491) | (1,289,480) | (1,588,940) | (1,465,511) |
| Depreciation of PPE | 121,499 | 110,039 | 101,524 | 89,995 |
| Depreciation of ROU Assets | 50,119 | 48,456 | 47,144 | 45,262 |
| Amortisation of Intangible Assets | 53,962 | 58,132 | 67,217 | 69,003 |
| Impairment / ECL on Loans, Adv & Financing | 393,506 | 343,095 | 154,471 | (133,460) |
| Revaluation (Gain)/Loss on Fin Assets (FVPL) | (208,290) | 5,403 | (47,707) | (34,177) |
| Allowance/(Writeback) for Impairment on Other Assets | (851) | (306) | 1,100 | (282) |
| Interest Income from Fin Assets (FVCI) | (669,165) | (871,880) | (1,398,668) | (1,263,539) |
| Interest Income from Fin Investments (A) | (619,506) | (669,395) | (698,639) | (639,395) |
| Other Items | (4,063) | (24,919) | 232,302 | 133,532 |
| Operating profit before Working Capital changes | 2,453,520 | 2,335,776 | 2,004,051 | 2,569,369 |
| Changes in Operating Assets | ||||
| Decrease/(Increase) in Placements with Banks (3m+) | (477,104) | 237,426 | 282,070 | (2,702,204) |
| Loans, Advances and Financing | (12,898,199) | (13,789,491) | (13,575,126) | (16,523,047) |
| Fin Assets at FV through P&L | 1,068,766 | 1,694,133 | 2,344,562 | (4,446,249) |
| Statutory deposits with Central Banks | (27,045) | (2,876,270) | 182,442 | 1,186,739 |
| Derivative Assets – Decrease/(Increase) | (1,084,504) | (547,176) | 496,056 | (1,150,946) |
| Fin Assets Purchased under Resale Agreements | 0 | 0 | (297,315) | (181,733) |
| Change in Other Assets | 2,018 | (168,814) | (1,353,718) | 1,194,614 |
| Changes in Operating Liabilities | ||||
| Deposits from Customers | 14,362,994 | 14,667,682 | 9,039,947 | 20,026,347 |
| Deposits from Financial Institutions | (5,807,789) | 3,271,576 | 1,777,113 | (921,543) |
| Investment Account of Customers | 1,523,254 | (417,895) | (83,979) | 102,525 |
| Obligations in Securities Sold under Repurchase Agmt | 3,228,554 | 3,428,279 | 2,424,066 | (3,225,913) |
| Derivative Liabilities – Increase/(Decrease) | 827,172 | 651,354 | (581,656) | 897,382 |
| Bills and Acceptances Payable | 51,719 | (29,930) | 71,116 | (6,048) |
| Change in Other Liabilities | 373,781 | 195,922 | 1,192,898 | 73,328 |
| Income Tax Expense and Zakat Paid | (1,095,221) | (1,030,371) | (652,872) | (843,283) |
| Cash Flow from Operating Activities | 2,501,916 | 7,622,201 | 3,269,655 | (3,950,662) |
| Purchase PPE | (115,678) | (132,069) | (82,468) | (101,129) |
| Disposal PPE | 1,890 | 377 | 9,434 | 18,900 |
| Net Sale/(Purchase) of Fin investments (FVCI) | 7,863,800 | (7,479,290) | (6,849,768) | 3,709,554 |
| Net Sale/(Purchase) of Fin investments (Amortised) | (8,104,000) | 1,833,797 | 42,096 | 4,230,157 |
| Purchase of Intangible Assets | (35,442) | (37,156) | (17,647) | (15,071) |
| Interest Income from Fin Assets (FVCI) | 0 | 0 | 1,398,668 | 1,157,966 |
| Interest Income from Fin Investments (A) | 0 | 0 | 698,639 | 774,364 |
| Dividends from Associates & JV | 0 | 0 | 330,808 | 392,344 |
| Other Items | 101,407 | 91,001 | 50,170 | 143,557 |
| Cash Flow from Investing Activities | (288,023) | (5,723,340) | (4,420,068) | 10,310,642 |
| Dividends paid to Shareholders | (1,089,942) | (1,188,226) | (1,291,111) | (1,455,499) |
| Repayment of Lease Liabilities | (44,321) | (44,402) | (44,356) | (44,622) |
| Issuance of Debt Securities | 1,550,000 | 3,200,000 | 2,345,000 | 1,934,000 |
| Redemption of Debt Securities | 0 | (900,000) | (1,495,000) | (484,000) |
| Proceeds/(Repayment) of Recourse Loans Sold to Cagamas | (64,174) | (962,930) | 0 | (1,550,024) |
| Interest Paid on Loans Sold to Cagamas | (40,430) | (66,196) | (122,738) | (127,994) |
| Interest Paid on Other Debt Securities & Leases | (115,234) | (154,128) | (158,742) | (172,641) |
| Other Items | 916 | 0 | 0 | 0 |
| Cash Flow from Financing Activities | 196,815 | (115,882) | (766,947) | (1,900,780) |
| Net Cash Flow | 2,410,708 | 1,782,979 | (1,917,360) | 4,459,200 |
| Effects of Exchange Rate Changes | 96,466 | 160,892 | 7,430 | (250,616) |
Income & Cost Metrics
| Year Ending |
2022 30-Jun |
2023 30-Jun |
2024 30-Jun |
2025 30-Jun |
| (RM'000) | ||||
| Interest Income | 5,505,696 | 7,370,454 | 8,677,088 | 8,774,986 |
| Interest income for Fin Assets at FV through P&L | 217,168 | 160,370 | 106,136 | 113,994 |
| Interest Expense | (1,967,533) | (3,846,739) | (4,961,438) | (4,901,454) |
| Net Interest | 3,755,331 | 3,684,085 | 3,821,786 | 3,987,526 |
| Islamic Banking Income | 904,785 | 963,368 | 985,948 | 1,159,833 |
| Other Operating Income* | 937,292 | 1,038,056 | 963,286 | 1,250,671 |
| Total Operating Income | 5,597,408 | 5,685,509 | 5,771,020 | 6,398,030 |
| Operating Cost** | (2,098,376) | (2,233,282) | (2,338,876) | (2,479,199) |
| Cost-to-Income Ratio (%) | 37.5% | 39.3% | 40.5% | 38.7% |
| Year Ending |
2022 30-Jun |
2023 30-Jun |
2024 30-Jun |
2025 30-Jun |
| *Other Operating Income (RM'000) | ||||
| Fee & Commission Income (Net) | 609,663 | 598,853 | 679,563 | 719,514 |
| Realised Gain/(Loss) on Fin Instruments | 50,022 | 66,890 | 33,904 | 237,204 |
| Unrealised Gain/(Loss) on Fin Instruments | 308,656 | 105,976 | 33,656 | (72,220) |
| Dividend Income | 101,407 | 91,001 | 50,170 | 59,486 |
| Foreign Exchange Gain/(Loss) | (143,943) | 144,564 | 125,944 | 258,421 |
| Other Income | 11,487 | 30,772 | 40,049 | 48,266 |
| Total | 937,292 | 1,038,056 | 963,286 | 1,250,671 |
| Year Ending |
2022 30-Jun |
2023 30-Jun |
2024 30-Jun |
2025 30-Jun |
| **Operating Cost (RM'000) | ||||
| Personnel | (1,153,764) | (1,202,989) | (1,284,434) | (1,333,065) |
| Establishment costs | (520,575) | (532,023) | (530,649) | (523,984) |
| Marketing expenses | (171,471) | (195,975) | (180,917) | (237,687) |
| Administration and general expenses | (252,566) | (302,295) | (342,876) | (384,463) |
| Total | (2,098,376) | (2,233,282) | (2,338,876) | (2,479,199) |
| Profit Before Tax (RM'000) | 4,366,800 | 4,626,631 | 5,134,247 | 5,360,339 |
| Personnel Costs / Profit Before Tax (%) | 26.4% | 26.0% | 25.0% | 24.9% |
| Personnel Costs / Operating Cost (%) | 55.0% | 53.9% | 54.9% | 53.8% |
STAKEHOLDERS
Directors & CEO Remuneration
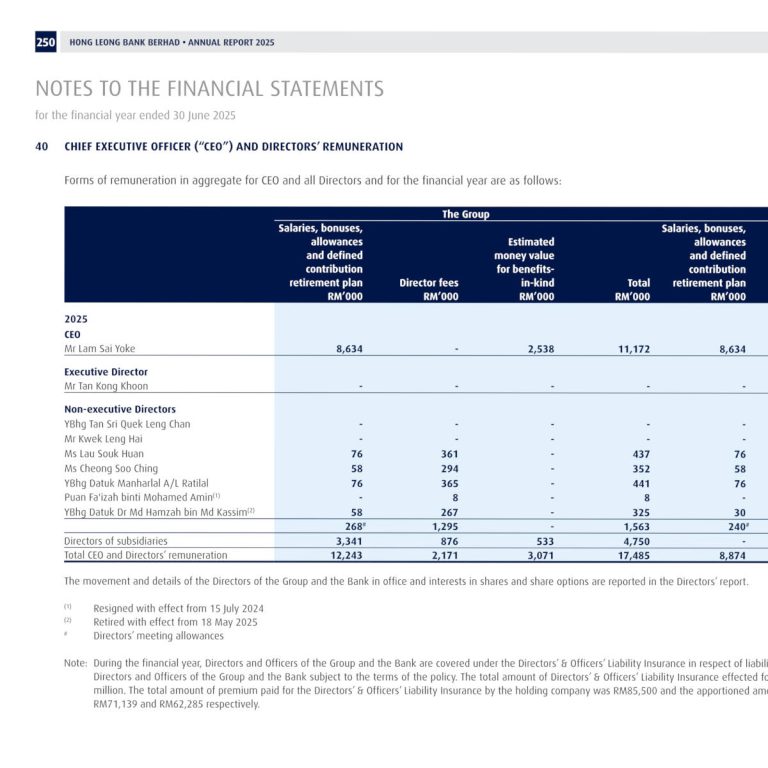
Executive & CEO: RM11.2 million
Non-Executive: RM1.5 million
Subsidiaries: RM4.8 million
CEO: RM11.2 million
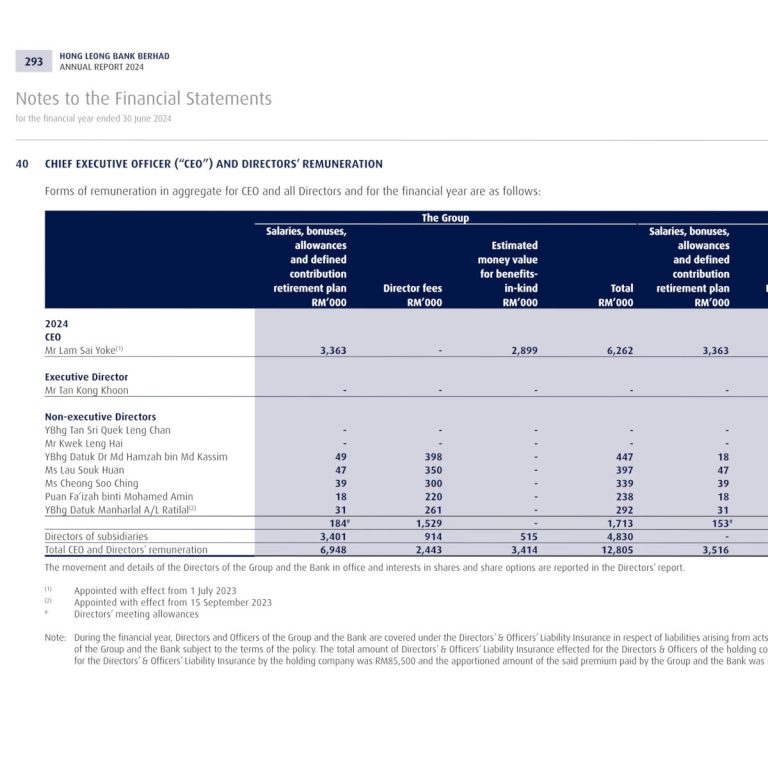
Executive & CEO: RM6.3 million
Non-Executive: RM1.7 million
Subsidiaries: RM4.8 million
CEO: RM6.3 million
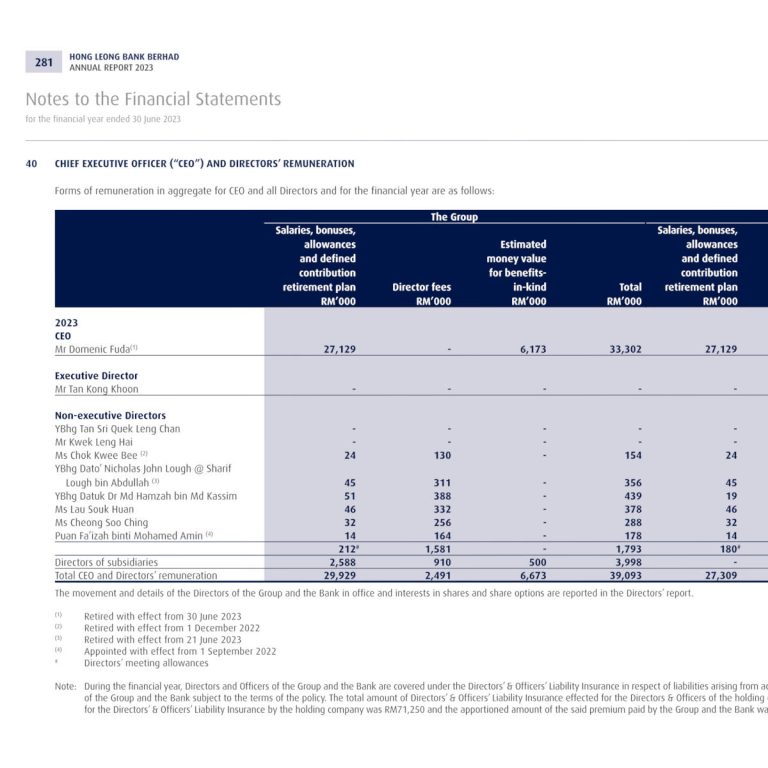
Executive & CEO: RM33.3 million
Non-Executive: RM1.8 million
Subsidiaries RM4.0 million
CEO: RM33.3 million
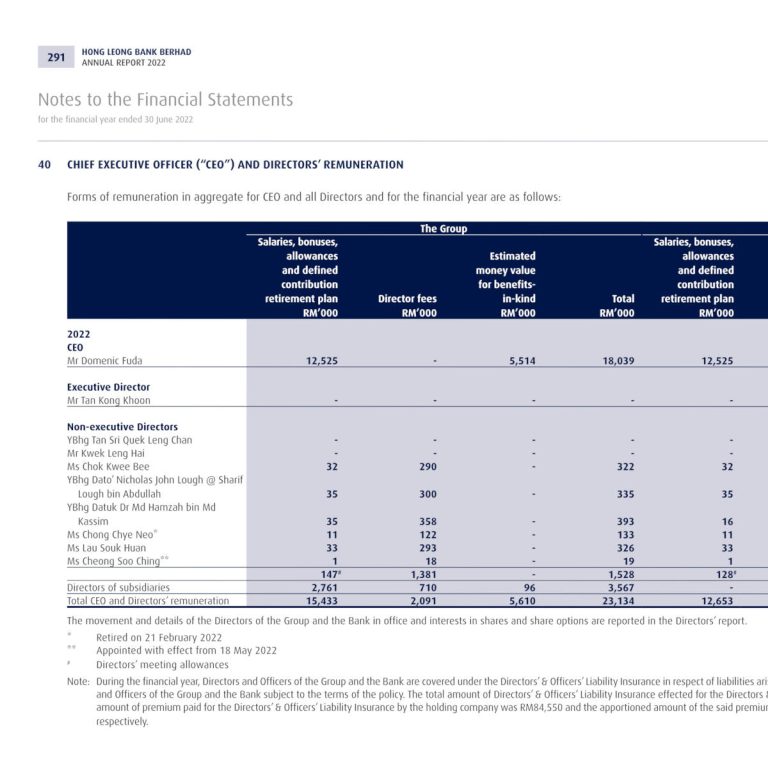
Executive & CEO: RM18.0 million
Non-Executive: RM1.5 million
Subsidiaries: RM3.6 million
CEO: RM18.0 million
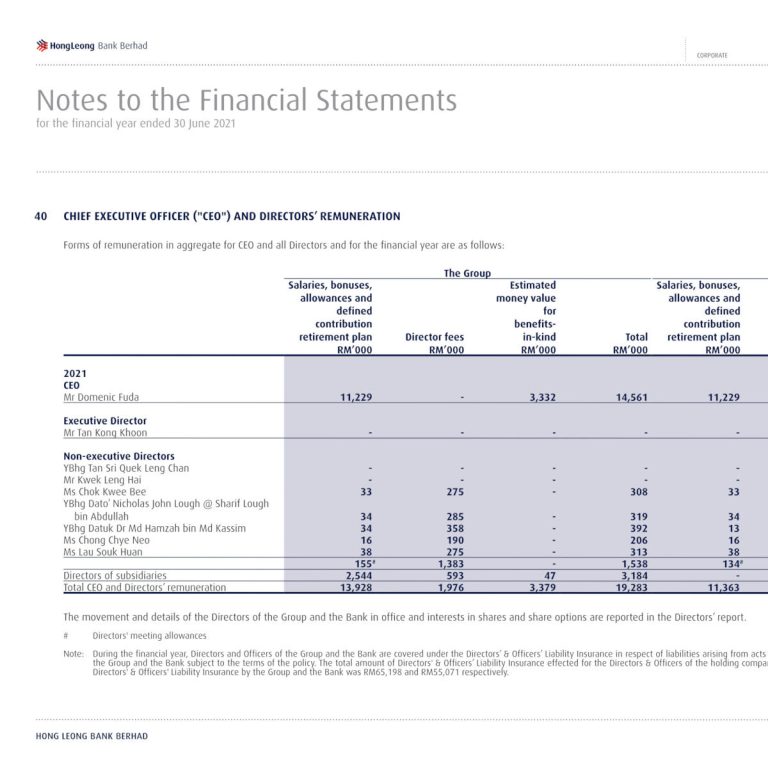
Executive & CEO: RM14.6 million
Non-Executive: RM1.5 million
Subsidiaries: RM3.2 million
CEO: RM14.6 million
Directors & CEO Interests
CORPORATE DEVELOPMENTS
Hong Leong Bank to reduce Bank of Chengdu stake?
Recent media reports have suggested that Hong Leong Bank Bhd (HLBB) may be intending to divest up to a 5% stake in its Associate company, Bank of Chengdu (BoCD). HLBB currently holds a 17.8% in the Chinese lender.
HLBB is the second largest shareholder in BoCD behind Chengdu Jiaozi Financial Holding Group Co Ltd, which is a state-owned company and the controlling shareholder of BoCD.
For FY2025, HLBB’s equity accounted earnings for Associate companies amounted to RM1.47 billion, the bulk of which came from BoCD. Earnings has grown to the extent that it is almost at a similar level to its Business & Corporate Banking operations.
Accounting for around 26% of HLBB’s Profit Before Tax, BoCD’s earnings contribution is up from 21% five years before. BoCD has recorded strong growth since 2021, expanding its commercial and SME customer base within the local business community and benefiting from supportive policies from central and provincial governments (Source: HLBB Annual Report 2025 Page 53, Annual Report 2024 Page 21).
BoCD’s substantial earnings contribution has become a problem for HLBB, one many would agree is a nice problem to have.
In 2024, BoCD’s reported Net Profit was RMB12.9 billion, up from RMB11.7 billion in 2023. BoCD’s share price closed at RMB16.12 at the end of December 2025 giving it a market cap of RMB68 billion. It reached a peak of RMB20.96 at the end of June 2025 before hitting reverse gear.
During the financial quarter ending 31 March 25, HLBB had to book a one-off loss of RM408 million, of which RM393 million was due to the dilution of its stake in BoCD. This was a non-cash item resulting from the conversion of BoCD’s into ordinary shares, thereby increasing BoCD’s total share capital from 3,814 million to 4,238 million shares. HLBB holds 753.5 million shares with a market value of RMB12.1 billion as at 31/12/25 or around RM7.1 billion. According to HLBB’s 2025 Annual Report, the carrying book value of its Associate investments is as below.

Although the carrying book value of its BoCD investment is not shown here, Note 14 of the Financial Statements mentions that the market value of its investment in BoCD was below the carrying amount as at 30 June 2025. HLBB has chosen not to book any impairment loss as it reasons that the recoverable amount was higher than the carrying value when determined under a value-in-use (“VIU”) calculation using a discounted cash flow model.
According to the bank, the plan to partially divest is at an early stage and it has not identified any buyers for this. The bank said reasonable pricing for the deal would be between 0.9 times and 0.95 times of the book value of BoCD at end-September 2025.
As at 30/6/2025, BoCD’s Shareholders Equity stood at RMB88.5 billion, implying that HLBB may be looking at a break-even scenario for its divestment.
Should HLBB pare down a 5% stake in BoCD successfully, it may unlock RM2.5 billion+ of liquidity that can be used to further its growth in core businesses in Malaysia, Singapore and Vietnam, as well as paid out as a special dividend.
So will there be a Special Dividend?
While HLBB’s dividend payout is still below peer average, it has increased significantly to 96 sen (or 46% of EPS) for FY2025. In its response to shareholder questions in its AGM on 27/10/25, HLBB stated it is progressively working on moving the payout to market average to reward shareholders. Indeed HLBB has a solid track record in rewarding shareholders with its increasing stream of dividends and share price growth over the last 10 years. Furthermore the implementation of Basel III regulatory adjustments could raise the bank’s Common Equity Tier 1 (CET1) ratio by around 50 basis point in FY26. A special dividend and/or increased payout ratio is realistic and investors have little reason to bet against this if a deal should materialise.
Further Reading: The Star, New Strait Times, TheEdge