ALLIANCE BANK MALAYSIA BERHAD (ABMB 2488)
SNAPSHOT
With a corporate tagline “The Bank for Life”, Alliance Bank operates multiple delivery channels including retail branches, online banking, Privilege Banking Centres, Islamic Banking Centres, Business Centres, Investment Bank branches and direct marketing offices, largely targeting the SME and consumer banking space in Malaysia. Key shareholders include Vertical Theme, a company linked to Singapore’s Temasek Holdings.
1982: Malaysian French Bank Berhad was incorporated to assume the banking business of the two local branches of Banque Indosuez. The incorporation followed the French government’s
nationalisation of Banque Indosuez and also of the subsequent restructuring of the Bank’s businesses in Malaysia to comply with local banking regulations.
1996: Renamed Multi-Purpose Bank Berhad.
2001: The bank assumed the name Alliance Bank Malaysia Berhad following the merger of seven financial institutions (including Multi-Purpose Bank, Alliance Finance Bhd, Alliance Merchant Bank Bhd and Alliance Unit Trust Management Berhad).
2005: Alliance Merchant Bank acquired Kuala Lumpur City Securities (KLCS) in a move to expand its stockbroking capabilities.
2017: The bank completed a corporate reorganization, assuming the listing status of Alliance Financial Group Berhad on the Main Market of Bursa Malaysia.
| YE 31-Mar | 2020 | 2021 | 2022 | 2023 | 2024 | 2025 |
| Profit Before Tax (RM mil) | 568 | 484 | 827 | 887 | 911 | 993 |
| Net Profit After Tax (RM mil) | 424 | 359 | 573 | 678 | 690 | 751 |
| EPS (RM) | 0.274 | 0.232 | 0.37 | 0.438 | 0.446 | 0.49 |
| DPS (RM) | 0.06 | 0.0579 | 0.185 | 0.22 | 0.223 | 0.19 |
| Net Loans (RM mil) | 43,110 | 43,234 | 45,124 | 47,926 | 54,721 | 61,419 |
| Customer Deposits (RM mil) | 48,426 | 48,489 | 48,186 | 50,849 | 57,398 | 65,835 |
| Shareholders Funds (RM mil) | 5,989 | 6,258 | 6,417 | 6,747 | 7,175 | 7,669 |
| Net Assets / Total Assets (%) | 9.8% | 10.3% | 10.4% | 10.2% | 9.3% | 9.0% |
| NTA per share (RM) | 3.59 | 3.76 | 3.87 | 4.07 | 4.34 | 4.62 |
| No of Shares (millions) | 1,548 | 1,548 | 1,548 | 1,548 | 1,548 | 1,548 |
| Share Price – Close (RM) | 1.90 | 2.65 | 3.76 | 3.40 | 3.69 | 4.62 |
| Financial Ratios (%) | ||||||
| Return on Av Equity | 7.2% | 5.9% | 9.0% | 10.3% | 9.9% | 10.1% |
| Cost to Income Ratio | 48% | 44% | 44% | 46% | 48% | 48% |
| Loan to Deposit Ratio | 90% | 91% | 96% | 96% | 97% | 95% |
| Impaired Loans | 1.3% | 2.1% | 2.3% | 2.3% | 1.8% | 0.4% |
| Net Interest / Total Interest Income | 47% | 57% | 67% | 62% | 53% | 51% |
| Interest Income / Av Net Loans | 4.8% | 4.2% | 3.8% | 4.2% | 4.8% | 4.9% |
SHARE TRADING SUMMARY CY2025
| Share Price - High | RM5.26 |
| Share Price - Low | RM3.83 |
| Share Price - Close @ 31/12/25 | RM5.05 |
| Average Daily Volume | 2,647,761 shares |
| Volume - High | 38,318,000 shares |
| Volume - Low | 142,300 shares |
| Total Annual Volume | 646,053,685 shares |
|
Annual Turnover (% of Share Capital) |
41.7% |
TOP SHAREHOLDERS
| As at 28 February 2025 | Direct | Deemed |
| Vertical Theme Sdn Bhd | 29.06% | - |
| Employees Provident Fund Board | 9.33% | - |
| Total | 38.39% |
LOAN SEGMENTATION
FY2024 SEGMENT EARNINGS (RM mil)
| Consumer Banking | 130,578 |
| Business Banking | 561,846 |
| Financial Markets | 318,887 |
| Stockbroking & Corp Advisory | 0 |
| Others | (10,432) |
| Inter-segment Elim | (8,001) |
| Associates | 47 |
| Profit Before Tax (FY2024) | 992,925 |
FINANCIALS
|
(RM '000) Year Ending |
2024 31-Mar |
2025 31-Mar |
| Interest Income | 2,465,837 | 2,865,144 |
| Interest Expense | (1,156,265) | (1,414,017) |
| Net Interest | 1,309,572 | 1,451,127 |
| Modification Gain/(Loss) | 0 | 0 |
| Islamic Banking Income | 440,111 | 547,078 |
| Other Operating Income | 270,767 | 271,734 |
| Other Operating Expenses | (973,729) | (1,088,499) |
| Impairment on Loans, Advances and Financing | (134,895) | (187,947) |
| Impairment on Other Assets | (545) | (615) |
| Writebacks & Other Recoveries | 0 | 0 |
| Share of Results of Associates & JV | 41 | 47 |
| PBT from Continuing Operations | 911,322 | 992,925 |
| Tax Expense | (220,847) | (242,199) |
| PAT from Continuing Operations | 690,475 | 750,726 |
| Profit After Tax | 690,475 | 750,726 |
| Non-Controlling Interests | 0 | 0 |
| Net Profit After Tax | 690,475 | 750,726 |
| EPS Basic / Diluted (RM) | 44.6 | 48.5 |
|
(RM '000) Year Ending |
2024 31-Mar |
2025 31-Mar |
| Net Loans | 54,720,750 | 61,418,548 |
| Cash | 4,596,653 | 4,588,931 |
| Deposits with FI | 0 | 611,989 |
| Fin Assets (FVPL) | 335,238 | 305,999 |
| Fin Assets (FVCI) | 10,047,311 | 11,199,629 |
| Fin Investments (Amortized) | 3,870,445 | 4,065,023 |
| Derivative Financial Instruments | 183,035 | 151,261 |
| Statutory Deposits | 1,125,413 | 1,276,202 |
| Intangible Assets | 462,372 | 517,038 |
| Right-Of-Use Assets | 120,970 | 116,929 |
| Goodwill | 0 | 0 |
| Associates & JV | 1,135 | 1,182 |
| Other Assets | 1,482,800 | 964,574 |
| Total Assets | 76,946,122 | 85,217,305 |
| Deposits from Customers | 57,397,495 | 65,834,954 |
| Deposits from Financial Institutions | 2,055,057 | 2,054,909 |
| Investment accounts of customers | 0 | 0 |
| Obligations on Securities Sold under Repurchase Agmts | 2,022,726 | 1,724,476 |
| Bills and Acceptances Payable | 0 | 0 |
| Recourse Obligations on Loans Sold to Cagamas | 1,227,674 | 905,646 |
| Derivative Financial Liabilities | 287,067 | 247,625 |
| Financial Liabilities (FVPL) | 1,928,111 | 1,883,460 |
| Debt Securities & Borrowings | 0 | 502,644 |
| Subordinated Obligations | 1,571,918 | 1,872,304 |
| Lease Liabilities | 124,712 | 117,124 |
| Other Liabilities | 3,156,234 | 2,405,716 |
| Total Liabilities | 69,770,994 | 77,548,858 |
| NET ASSETS | 7,175,128 | 7,668,447 |
| Share Capital | 1,548,106 | 1,548,106 |
| Retained Profits | 5,549,407 | 6,014,117 |
| Regulatory Reserves | 155,485 | 117,173 |
| Treasury Shares | 0 | 0 |
| Other Reserves | (77,870) | (10,949) |
| Shareholder Funds | 7,175,128 | 7,668,447 |
| Non-Controlling Interests | 0 | 0 |
| TOTAL EQUITY | 7,175,128 | 7,668,447 |
| No of Shares (Thousands) | 1,548,106 | 1,548,106 |
| Weighted Av Shares (Thousands) | 1,548,106 | 1,548,106 |
| Share Price (RM) | 3.69 | 4.62 |
|
(RM '000) Year Ending |
2024 31-Mar |
2025 31-Mar |
| Profit Before Tax | 911,322 | 992,925 |
| Non-Cash Items (Depreciation, Share of Associates, Loan Impairments & Other Items) | (41) | (47) |
| Operating Profit Before Working Capital Changes | 848,492 | 963,257 |
| Loans, Advances and Financing | (6,917,674) | (6,931,755) |
| Movement in Other Operating Assets | (474,162) | 767,797 |
| Deposits from Customers | 6,548,465 | 8,437,459 |
| Movement in Other Operating Liabilities | 956,099 | (741,790) |
| Income Tax Expense and Zakat Paid | (228,191) | (257,857) |
| Other Operating Items | (19,727) | 20,841 |
| Cash Flow from Operating Activities | 2,417,541 | 1,708,448 |
| Net Purchase of Property Plant & Equipment | (198,875) | (280,043) |
| Other Investing Items | (41,101) | 0 |
| Cash Flow from Investing Activities | (1,814,756) | (1,155,197) |
| Dividends Paid to Shareholders | (322,781) | (324,328) |
| Dividends Paid to Non-Controlling Interests | 0 | 0 |
| Repayment of Lease Liabilities | (33,595) | (40,064) |
| Net Issuance/(Redemption) of Debt Securities | 0 | 0 |
| Other Financing Items | 0 | 0 |
| Cash Flow from Financing Activities | 423,212 | 21,943 |
| Net Cash Flow | 1,025,997 | 575,194 |
| Effects of Exchange Rate Changes | (43,736) | 67,315 |
Income & Cost Metrics
| Year Ending |
2024 31-Mar |
2025 31-Mar |
| (RM'000) | ||
| Interest Income | 2,465,837 | 2,865,144 |
| Interest Expense | (1,156,265) | (1,414,017) |
| Net Interest | 1,309,572 | 1,451,127 |
| Islamic Banking Income | 440,111 | 547,078 |
| Other Operating Income* | 270,767 | 271,734 |
| Total Operating Income | 2,020,450 | 2,269,939 |
| Operating Cost** | (973,729) | (1,088,499) |
| Cost-to-Income Ratio (%) | 48.2% | 48.0% |
| Year Ending |
2024 31-Mar |
2025 31-Mar |
| *Other Operating Income (RM'000) | ||
| Fee & Commission Income (Net) | 147,297 | 113,296 |
| Realised Gain/(Loss) on Fin Instruments | 156,387 | 106,496 |
| Unrealised Gain/(Loss) on Fin Instruments | (15,345) | (40,037) |
| Dividend Income | 1,356 | 1,357 |
| Foreign Exchange Gain/(Loss) | (43,736) | 67,315 |
| Other Income | 24,808 | 23,307 |
| Total | 270,767 | 271,734 |
| Annual Report Ref (PDF Page) |
Note 32 (p260 - p261) |
Note 30 (p292) |
| Year Ending |
2024 31-Mar |
2025 31-Mar |
| **Operating Cost (RM'000) | ||
| Personnel Costs | (629,816) | (684,495) |
| Establishment Costs | (215,724) | (257,312) |
| Marketing Expenses | (47,072) | (62,081) |
| Administration and General Expenses | (81,117) | (84,611) |
| Total Operating Cost | (973,729) | (1,088,499) |
| Annual Report Ref (PDF Page) | Note 33 (p262) | Note 31 (p293) |
| Profit Before Tax (RM'000) | 911,322 | 992,925 |
| Personnel Costs / Profit Before Tax (%) | 69.1% | 68.9% |
| Personnel Costs / Operating Cost (%) | 64.7% | 62.9% |
STAKEHOLDERS
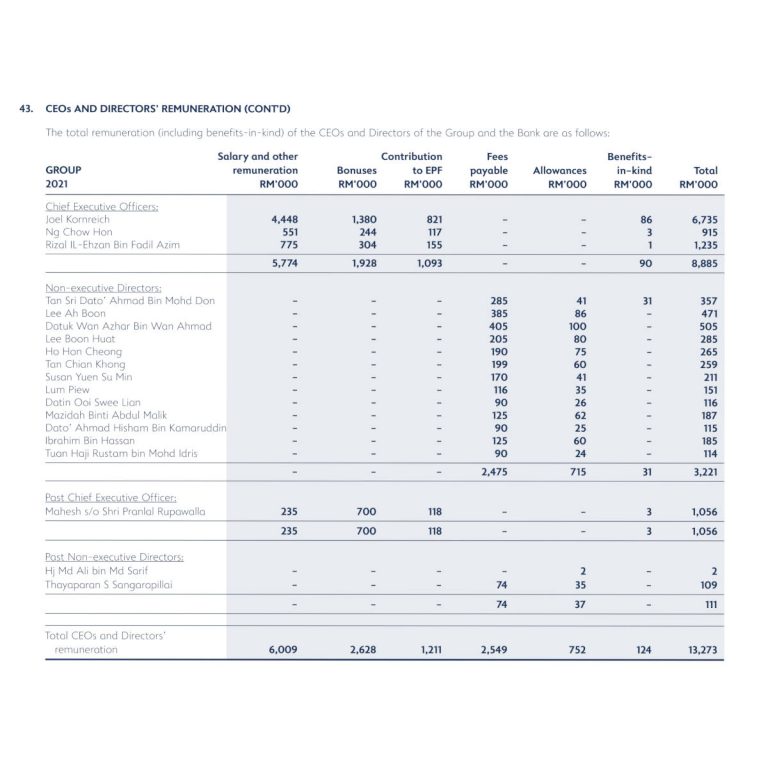
Directors & CEO Remuneration
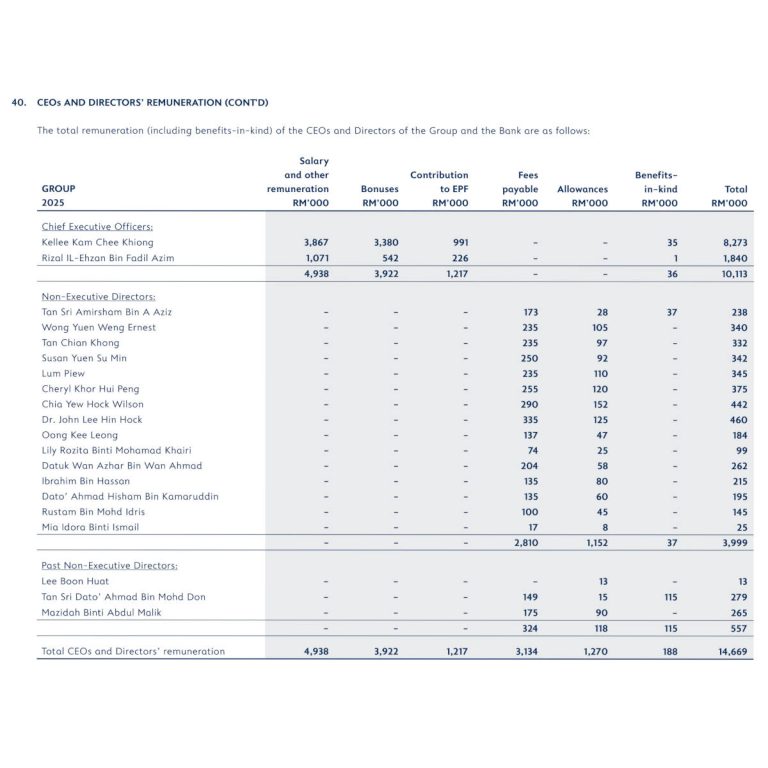
Executive & CEO: RM10.1 million
Non-Executive: RM4.6 million
CEO: RM10.1 million
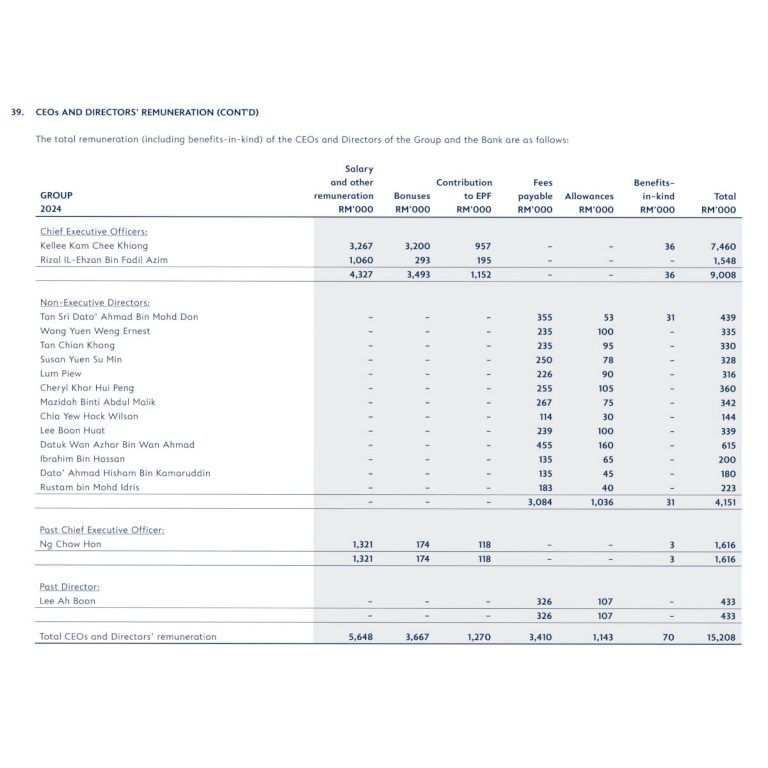
Executive & CEO: RM10.6 million
Non-Executive: RM4.6 million
CEO: RM10.6 million
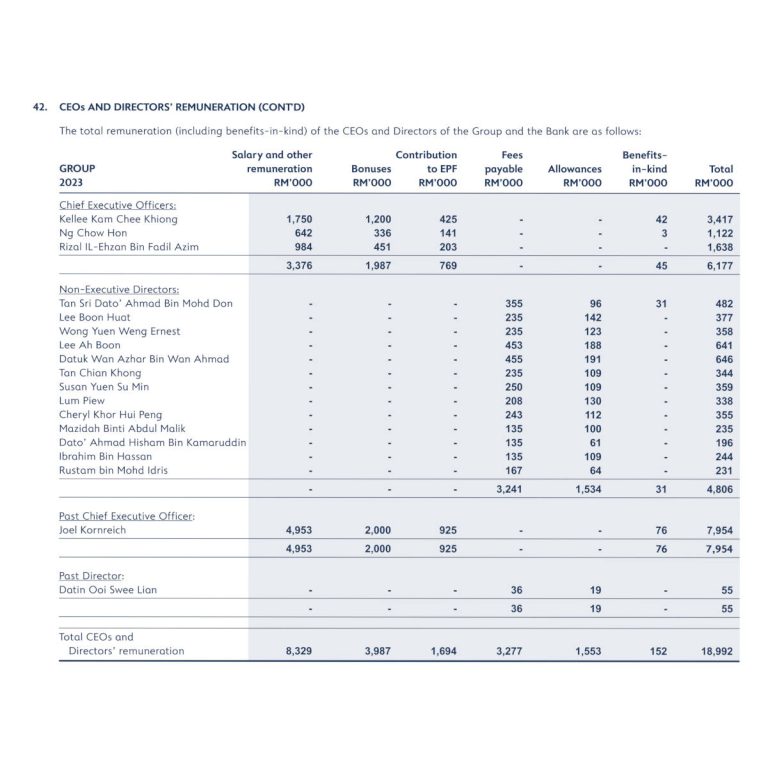
Executive & CEO: RM14.1 million
Non-Executive: RM4.9 million
CEO: RM14.1 million
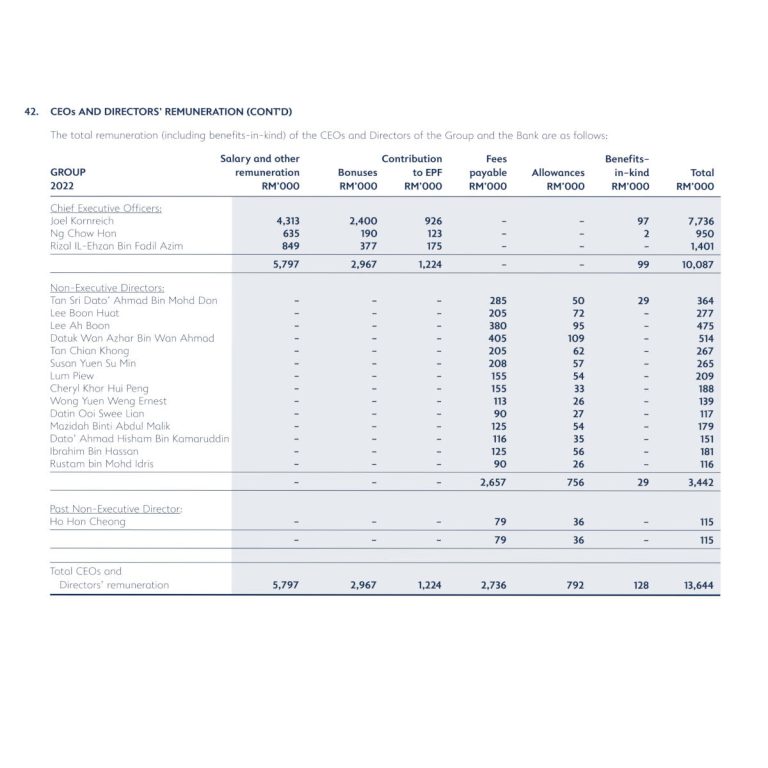
Executive & CEO: RM10.1 million
Non-Executive: RM3.5 million
CEO: RM10.1 million
Executive & CEO: RM10.0 million
Non-Executive: RM3.3 million
CEO: RM10.0 million
Directors & CEO Interests
CORPORATE DEVELOPMENTS
Alliance Bank 2 for 17 Rights Issue to raise RM602 million
Alliance Bank has fixed its rights price at MYR3.33/rights share with an entitlement basis of 2 rights shares for every 17 existing shares.
Key Dates:
Ex-Rights: 13 Jun 2025
Rights to Commence trading: 17 Jun 2025
Prospectus Despatch and Provisional Allotment Letter of Offer: 18 Jun 2025
Acceptance, Renunciation and Payment Dateline: 2 Jul 2025
Rights cessation quotation: 24 Jun 2025
The rights are expected to be credited on 16 June. Trading of the rights is expected to commence on 17 June to 24 June.
Announcement of the final subscription result is scheduled for 8 July and the rights are expected to be listed on 15 July 2025.
Financial Impact
No of Shares Currently: 1,548,106 shares
Rights Shares: 182,130
No of Shares on Completion: 1,730,236
Currently Market Cap @ RM4.33: RM6,703 million
Currently Market Cap less 9.9 sen dividend: RM6,550 million (Note: Upcoming Interim DPS of 9.9sen/share ex-date on 12/6/25)
Amount to be raised RM602 million (Gross proceeds of RM606.5m from the issue less EM4.8m rights issue expenses).
Theoretical Market Cap Ex-Rights: RM7,152 million.
Theoretical Share Price ExDiv and Ex-Rights: RM4.13
Impact on CET1 Capital Ratio
The rights issue will be positive to the group’s capital position, improving its end-Mar 2025 CET1 ratio by about 1.1%-points to 13.3% from 12.2%.
Current CET1 @ 31/3/25: RM6,813 mil
Less Final Dividend: (RM154 mil)
Net Rights Proceeds: RM602 mil
CET1 Ex-Rights: RM7,261 mil
Risk Weighted Asets: RM54,656 mil
Enhanced CET1 Ratio: 13.3%