Why Has the Market Not Crashed Yet?
The rampage on the S&P 500 index has been impressive to say the least. Nearing the 7,000 level at the end of Jan 2026, how long can it keep flirting with record highs after record highs?
It flirted with the 6,000 level only a year ago, in the month preceding Liberation Day Tariffs, then gave way to the “bad” news when President Trump slapped the world with the announcement.
Since then it has powered on to gain 40% in a span of just nine months… seemingly immune to any bad news along the way.
So what’s with the confidence and why has the market not crashed yet?
Let’s differentiate a “market crash” from a market correction. According to conventional wisdom, a market correction is typically a short-term, 10% to 20% drop from recent peaks, generally considered to be good and healthy for the stock market.
In contrast a market crash is a sudden, drastic, and swift drop in share prices, typically exceeding 20%. It is characterized by an exceeding sense of panic, sometimes resulting from systemic issues or unexpected crises. Crashes can lead to prolonged bear markets resulting in overall declines of 40% or more from market peak to trough.
The stock market crash of 2008, considered by some to be the most severe since the Great Depression, saw the S&P 500 lose approximately 57% of its value from its peak (1,565.15) in October 2007 to its trough (676.53) in March 2009. During the 2008 calendar year alone, the S&P 500 fell by 37.6%.
The 1987 stock market crash, known as Black Monday, occurred on October 19, 1987, and stands as the largest single-day percentage decline in the history of the Dow Jones Industrial Average (DJIA). On that day, the Dow plummeted 22.6%, losing 508 points, while the S&P 500 lost 20.4%.
OK in this context, let’s take a look at this video which explains some of the forces holding up this market. It is presented in the US context but provides some clues as to why the Merry-go-Round is still spinning.
(Date of Video: 16 November 2026)
To sum it up…. The stock market should’ve already crashed. Every indicator is flashing red – Consumers are drowning in debt, valuations are high and most parts of the economy are cracking. Markets don’t crash when things look bad, they crash when the force that is holding everything together finally break.
One of indicators Warren Buffett’s looks at is Total Market Capitalization of all public companies divided by the US gross domestic product. The market cap of all US public companies is $66 trillion, while the US GDP is about $30 trillion. Divide 66 by 30 and you get 220%. Anything over 100% is considered overvalued. Note: Video was uploaded on 16 November 2026.
Do PE Ratios matter anymore? Apparently not. Historically S&P 500 companies have PE ratios around 15 to 16. Today it’s 25 to 28. Take a look at companies driving the S&P 500 and it gets even more unsettling. Nvidia’s PE Ratio is PE ratio is 53 to 55x. Amazon’s PE ratio is 35 to 37 and Microsoft is 35 to 40. And the real shocker is Tesla at almost 300x.
Before the.com crash in 1999, S&P 500 PE ratios were running at 29 to 32x.
Even though all the indicators have been flashing red – high inflation, rising consumer debt, slowing job market, layoffs, corporate earnings slowing down, elevated PE ratios and a grossly overvalued market, the market still hasn’t collapsed. Why? because two major forces are working to hold it up.
Force 1: Fiscal Stimulus
The government keeps stimulating the economy quietly. QE ended in 2023 but the US government is still running huge deficits and injecting money into the system. In December 2025, the U.S. government posted a $145 billion budget deficit for December, up 67% or $58 billion from a year earlier (See Reuters). This spending props up the economy by increasing consumer spending and elevating corporate profits and stocks stay inflated longer. But with $38 trillion in debt and an annual interest costs of more than $1 trillion how long can the government can keep spending like this?
Force 2: Dollar Devaluation and Inflation
Some countries notably the BRICS led by China want to see international transactions settled in currencies other than US dollars. This leads to decreasing demand for the dollar. At the same time, US treasuries are no longer the flight to safety it once was. That also decreases demand for the dollar. When demand for the dollar decreases the value of the dollar also decreases. President Trump’s desire to make exports more affordable adds more downward pressure on the dollar (LKFP: Treasury Secretary Scott Bessent’s recent remarks that “we always support a strong dollar policy” in the context of his stablecoin proposal somewhat contradicts this position). At the same time inflation has been stubborn and a weaker dollar exacerbates the problem. Every dollar you have is silently bleeding value even if your bank account balance hasn’t changed.
So how is this propping up the stock market?
The net result of inflation is that companies raise prices. When prices rise, corporate earnings rise, not because they become more innovative or productive but simply because the dollar doesn’t buy as much anymore. This is why companies can report record earnings even when fewer people are buying their products. It’s not growth it’s inflation disguised as growth. The smart money knows this. It leads to higher corporate valuations.
(LKFP: Inflation is loosely defined as rising prices in the economy. But more pertinently, it is a Hidden Tax and a tax on the Poor. Lower income earners need to spend a disproportionate amount of their income on basic needs as compared to higher income earners who own assets such as stocks and real estate. Essentially it is an economic phenomenon where the Rich gets richer and the Poor gets poorer.)
If you borrow money to buy assets like stocks and inflation rises, two things happen. Your debt becomes cheaper because you pay it back with less valuable dollars. Your asset value increases because the revenue potential (or ability to raise prices) increases. Inflation (LKFP: when interest rates are kept artificially low) works in favor of people who buy assets with debt. Big investors such as hedge funds and others who borrow large sums of money to buy stocks win big. These forces – fiscal stimulation and dollar devaluation & inflation are working together to prop up the market and keep the large investors in the game.
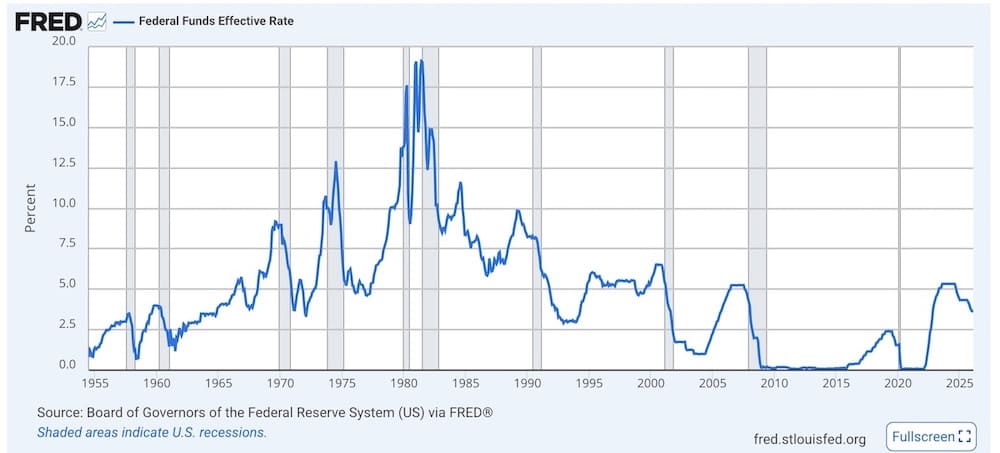
(LKFP: Interest Rates have been kept artificially low in to stimulate the economy resulting in high leverage and debt build up globally. The above chart shows that for the period between 1992 to 2026, the Fed Funds Rate largely stayed below 5%. Compare this to the period between 1968 to 1991 where it was largely above 5% and reaching high teens in the early 1980s. During the implementation of Quantitative Easing or QE between 2008 to 2022, interest rates were near zero for several years. It illustrates that the central bank was backed into a corner where interest rates, the price of money, was no longer a potent tool. Central banks resorted to QE which fiddled with the quantity of money to prop up broken economies. It comes at the inevitable cost of inflation… the Hidden Tax that strikes a huge blow to unsuspecting lower income earners and the “have-nots” who bought into the government’s rhetoric of saving their jobs and alleviating their pain.)
These forces propping up the market won’t last forever. They delay the crash, not prevent it.
Why this crash is taking longer than expected to arrive?
If all the signs are bad why hasn’t the crash already happened? This is where people misunderstand how markets actually work. Crashes don’t happen when conditions get bad. Crashes happen when confidence breaks. Think of an overloaded bridge. It doesn’t collapse when the first crack appears, it collapses when the final bolt snaps. Right now confidence is being held together by three threads. And all three are starting to fray.
First Thread: Consumers are still spending money they don’t have
The US economy is consumer based (making up 83% of GDP according to World Bank data). But personal savings are near record lows and credit card balances are at record highs. People are spending money they don’t have and that’s not sustainable. And when consumers finally stopped spending, earnings fall and markets follow.
Second Thread: The labor market has persevered but is showing cracks
The no hire no-fire labor market may not be around for much longer. Hiring has slowed significantly and layoffs are increasing. It’s not a strong labor market, it’s a lagging labour market, which happens right before downturns. Less people employed means less consumer spending.
Third Thread: Rate cuts won’t save this time.
In previous cycles lower interest rates gave markets a cushion but today’s economy is running on high debt, high costs and squeezed consumers. Lower rates won’t magically fix that.
And this brings us to the key part… the cycle of false confidence that always appears right before the real crash.
Here’s where it gets unsettling. Crashes don’t appear out of nowhere, they’re preceded by a familiar sequence.
Phase 1: Markets stay high for longer than anyone expects. People are frustrated because the markets disconnected from reality, it happens before every major downturn.
Phase 2: Investors become numb to bad news. it’s crash fatigue (doomsday prophets disappear from the headlines, all but incarcerated). People hear bad headline after bad headline and eventually stop caring. The public hears inflation, corporate layoffs, earnings warnings and thinks… whatever. This is classic pre-crash behavior. Bad news stop moving markets right before the moment it matters.
Phase 3: A confidence breaking event hits. It’s not always dramatic sometimes it’s small, a bankruptcy, a credit event, a major company missing earnings. That single event triggers a chain reaction. Confidence collapses, selling accelerates, and the crash everyone expected months ago finally shows up.
The crash may feel sudden when it does occur but only because people delay for safety. Delay sets up something worse. The crash isn’t cancelled… it’s queued, and the longer it’s delayed the bigger is the snowball effect.
The disclaimer at the end says it isn’t about predicting doom, it’s about understanding the cycle so you can protect yourself and stay rational when others panic.
Further Reading:
What We’ve Learned From 150 Years of Stock Market Crashes (Morning Star 19/2/26)
POST UPDATE 19/5/26
At this juncture, it’s useful to consider he words of Warren Buffett in a recent interview with CNBC’s Becky Quick.
Quick: Do you see the circumstances building up anywhere that could lead to a time like that again, any sort of panic in the market?
Buffett: Sure.
Quick: Where do you see them?
Buffett: Well, if you saw them, then they wouldn’t happen.
Quick: Okay.
Buffett: I mean, you’ve got all kinds – you don’t worry about what people are talking about can happen. It’s something that comes out of the blue, but something will come out of the blue. I mean, a nuclear bomb could come out of the blue.
See the full CNBC interview transcripts >>
With that in mind, here’s a trustworthy saying worth remembering:
“My son, do not let wisdom and understanding out of your sight,
preserve sound judgment and discretion;
they will be life for you,
an ornament to grace your neck.
Then you will go on your way in safety,
and your foot will not stumble.
When you lie down, you will not be afraid;
when you lie down, your sleep will be sweet.
Have no fear of sudden disaster
or of the ruin that overtakes the wicked,
for the LORD will be at your side
and will keep your foot from being snared.””
Proverbs 3:21-26 (NIV)